'%3e%3cpath%20d='M150.127%20195.325C233.04%20195.325%20300.255%20168.696%20300.255%20135.848C300.255%20103%20233.04%2076.3709%20150.127%2076.3709C67.2143%2076.3709%200%20103%200%20135.848C0%20168.696%2067.2143%20195.325%20150.127%20195.325Z'%20fill='white'/%3e%3cpath%20d='M231.093%20118.256L150.117%20-0.000183105L69.1527%20118.256C68.1365%20119.748%2067.5967%20121.294%2067.5967%20122.871C67.5967%20136.017%20104.538%20146.666%20150.117%20146.666C195.697%20146.666%20232.638%20136.007%20232.638%20122.871C232.638%20121.294%20232.098%20119.748%20231.082%20118.256H231.093Z'%20fill='%2301A9F2'/%3e%3cpath%20d='M150.106%20356.844L98.7265%20281.5L62.3035%20311.117L25.4253%20257.017L50.787%20239.721L68.8556%20266.226L105.279%20236.62L150.106%20302.363L194.934%20236.62L231.357%20266.226L270.045%20209.48L295.407%20226.776L237.898%20311.117L201.475%20281.5L150.106%20356.844Z'%20fill='white'/%3e%3cpath%20d='M592.168%20165.22V237.908H561.482V171.825C561.482%20153.884%20551.807%20143.034%20535.051%20143.034C516.644%20143.034%20505.318%20156.011%20505.318%20175.604V237.908H474.875V171.349C474.875%20153.407%20464.968%20142.791%20448.445%20142.791C429.804%20142.791%20418.711%20156.011%20418.711%20176.07V237.908H388.025V118.964H418.711V134.301C426.502%20122.033%20440.421%20115.418%20458.13%20115.418C477.014%20115.418%20490.7%20122.975%20498.247%20135.953C506.747%20123.208%20521.608%20115.418%20540.725%20115.418C572.819%20115.418%20592.179%20135.476%20592.179%20165.22H592.168Z'%20fill='white'/%3e%3cpath%20d='M899.48%2080.2534C899.48%2068.2182%20909.388%2059.4856%20920.248%2059.4856C931.574%2059.4856%20941.248%2068.9274%20941.248%2080.2534C941.248%2091.3465%20931.574%20100.788%20920.248%20100.788C909.155%20100.788%20899.48%2092.0557%20899.48%2080.2534Z'%20fill='white'/%3e%3cpath%20d='M935.832%20118.955H905.146V237.899H935.832V118.955Z'%20fill='white'/%3e%3cpath%20d='M1140.2%20118.955H1173L1099.84%20288.644H1067.5L1090.6%20237.666L1043.42%20118.955H1076.45L1107.37%20204.81L1140.18%20118.955H1140.2Z'%20fill='white'/%3e%3cpath%20d='M883.182%20115.418H815.904C781.45%20115.418%20755.008%20137.837%20755.008%20171.825C755.008%20206.756%20778.846%20228.466%20815.904%20228.466C831.951%20228.699%20847.288%20231.059%20847.288%20246.64C847.288%20259.617%20835.962%20267.175%20817.555%20267.175C799.148%20267.175%20784.985%20254.664%20781.915%20239.326L756.66%20246.873C763.741%20274.722%20787.346%20292.188%20817.312%20292.188C856.963%20292.188%20876.313%20272.838%20876.313%20249.233C876.313%20234.605%20869.231%20223.036%20855.545%20215.721C868.522%20206.047%20877.022%20190.709%20877.022%20171.825C877.022%20160.986%20871.412%20149.3%20863.145%20140.674H883.182V115.418ZM815.904%20203.919C797.264%20203.919%20782.392%20192.117%20782.392%20171.825C782.392%20151.534%20799.148%20139.964%20815.904%20139.964C832.66%20139.964%20849.416%20151.29%20849.416%20171.825C849.416%20188.814%20835.497%20203.919%20815.904%20203.919Z'%20fill='white'/%3e%3cpath%20d='M737.426%20237.906V118.962H708.158V136.088C698.685%20121.481%20682.796%20115.426%20668.983%20115.426C633.587%20115.426%20608.087%20143.509%20608.087%20179.148C608.087%20214.788%20633.1%20241.452%20668.03%20241.452C682.426%20241.452%20698.24%20235.08%20708.148%20220.917V237.906H737.415H737.426ZM673.471%20213.835C653.645%20213.835%20638.308%20199.207%20638.308%20178.429C638.308%20157.65%20653.889%20143.032%20673.704%20143.032C694.705%20143.032%20709.1%20160.021%20709.1%20178.429C709.1%20196.836%20694.472%20213.835%20673.46%20213.835H673.471Z'%20fill='white'/%3e%3cpath%20d='M1003.29%20111.085C1003.29%2098.5315%201011.17%2091.8842%201023.98%2091.8842C1028.9%2091.8842%201033.83%2092.6251%201037.77%2093.853L1042.2%2068.0043C1038.02%2066.7765%201027.43%2064.7971%201021.27%2064.7971C994.18%2064.7971%20972.607%2081.786%20972.607%20110.355V118.961H956.889V144.216H972.607V164.519V237.915H1003.29V144.216H1038.46V118.961H1003.29V111.096V111.085Z'%20fill='white'/%3e%3c/g%3e%3cdefs%3e%3cclipPath%20id='clip0_1_3'%3e%3crect%20width='1173'%20height='356.842'%20fill='white'/%3e%3c/clipPath%3e%3c/defs%3e%3c/svg%3e)

Level Progress Report and Dashboard
Overview
The Level Progress Report and Dashboard provide comprehensive insights into user progression through game levels and their interactions with in-game currency, boosters, and hints. These tools help game developers evaluate player behavior, retention patterns, and monetization strategies, ensuring optimized level design and enhanced engagement mechanics.
The Level Progress Report employs a cohort-based approach, aggregating data over a 30-day period from the date of app installation. Installation data is retrieved from AppsFlyer or Adjust, ensuring accurate user acquisition tracking.
The Level Progress Dashboard, on the other hand, offers real-time tracking of level completion trends, displaying a fixed date range of the last 24 days plus the current day.
Both tools rely on event data from gameplay sessions and in-game transactions, which require proper SDK configuration for accurate tracking. Simply integrating the SDK is not enough—developers must ensure event names follow the correct format and that necessary data is sent.
Key Features
1. Cohort-Based and Real-Time Analysis
- The Level Progress Report groups users into cohorts based on their installation date and aggregates data over 30 days post-installation.
- The Level Progress Dashboard presents daily data updates within a rolling 25-day window, allowing real-time monitoring of user progression.
2. Data Aggregation from Session and Transaction Events
- SessionEvent Model: Captures in-game actions such as level completion, failure, and retries.
- Transaction Model: Tracks in-game currency movements, booster usage, and hint consumption, providing insights into monetization behaviors.
- Events are sourced from the SDK, but prior configuration is required for proper data transmission and accuracy.
3. Level Progression Tracking
- Tracks user completion rates for each level and highlights difficulty spikes where users struggle.
- Measures average attempts per level, helping to balance difficulty and improve engagement.
4. In-Game Currency and Booster Impact
- Analyzes how currency usage correlates with level progression.
- Tracks booster and hint consumption to evaluate their effectiveness in retention and engagement.
- Provides monetization insights by linking in-game purchases with level completion data.
5. Retention and Engagement Insights
- Identifies patterns in user progression and highlights drop-off points.
- Helps optimize difficulty scaling and reward systems to improve long-term engagement.
6. Integration with Attribution Platforms
- Uses AppsFlyer and Adjust to match session and transaction data with user acquisition sources.
- Allows analysis of user progression across different marketing channels and campaigns.
7. Customizable Metrics and Filters
- The Level Progress Report supports filters for cohort selection, level range, and in-game currency usage.
- The Level Progress Dashboard provides daily-level tracking with interactive visualizations for immediate performance analysis.
- Both tools support additional KPIs for retention and engagement tracking.
Use Cases
- Game Balancing – Identify difficulty spikes impacting retention and adjust level design.
- Monetization Optimization – Understand how in-game purchases influence level completion and progression.
- User Retention Analysis – Evaluate drop-off points and adjust mechanics to improve player engagement.
- Marketing Performance – Correlate user acquisition sources with in-game behavior to refine targeting strategies.
Both the Level Progress Report and Dashboard are essential tools for game developers, allowing data-driven decision-making to enhance player experience, optimize retention, and maximize monetization.
Level Progress Report
The Level Progress Report analyzes user progression, tracking level completion, drop-offs, and monetization factors like in-game currency, boosters, and hints. It provides cohort-based insights over a 30-day period from installation, using data from AppsFlyer, Adjust, and gameplay events.
Accurate reporting requires proper SDK integration and correct event formatting. Developers must ensure event tracking aligns with reporting needs. Analysts may need to adjust configurations for game-specific behavior.
This report helps optimize level difficulty, retention strategies, and monetization impact.
Definition of Cohort and Cohort Analysis
Cohort
A cohort is a group of users who share one or more common characteristics, such as:
- A specific action (purchase, registration, click, etc.).
- A specific time frame in which the action occurred.
Cohorts are formed based on user behavior data, allowing for the analysis of user interactions with the application over time.
Differentiation Between Cohort and Segment
Cohorts should not be confused with segments. Unlike cohorts, segments represent broader user groups categorized by shared characteristics. For example, Harvard graduates from 2012 and those from 2018 belong to different cohorts but fall under the same segment of “Harvard graduates.”
Cohort Analysis
Cohort analysis is a research method in which users are grouped into cohorts and their behavior is tracked over a defined period. This approach helps identify trends in user behavior dynamics, retention, engagement, and response to changes in game mechanics.
SDK Data and Client ID Matching
To ensure accurate reporting, it is essential to establish a reliable connection between app installations and SDK data. This connection is maintained through an internal user identifier, Client ID. The Client ID must meet the following criteria for consistency:
- It must be received both from the Mobile Measurement Partner (MMP) (AppFlyer or Adjust) and the SDK.
- The Client ID must be identical across both sources to correctly attribute user data.
Metric Segmentation and Automatic Switching
The report is structured into two metric categories:
- Event-based metrics
- Transaction-based metrics
Metric availability is dynamically adjusted based on the selected filter or dimension, following the "at least one" principle. This means:
- If any chosen filter/dimension lacks compatibility with a specific set of metrics, those unavailable metrics will be automatically excluded from the report.
- Even if other selected filters/dimensions support all metrics, any restricted metrics due to the initial selection will remain hidden.
Example: Transaction vs. Event Metric Availability
- Transactions and Boosters Source
- The SDK transmits transaction data, including the source of in-game currency (Boosters Source).
- Transactions can be linked to specific in-game currency sources.
- However, for event-based data (e.g., level start, success/failure completion), no direct association exists with the in-game currency source.
- As a result, when filtering by Boosters Source, only six currency-related metrics will be available, while eight event-based metrics (level start and completion) will be excluded.
- Game Level DimensionWhen filtering by game level, it is possible to determine both the level where a booster was obtained and the level where a player started or completed an event. Consequently, when filtering by game level, all metrics remain accessible.For additional details, refer to the tooltip section below.
Filters and Dimensions
The Filters and Dimensions table is used for setting up analytics and reporting within the system. It allows users to filter data based on various parameters and group it into meaningful segments for analysis.
- Filters help narrow down the dataset by displaying only the relevant values based on specified criteria.
- Dimensions are used to group data by different attributes, such as date, platform, country, and other metrics.
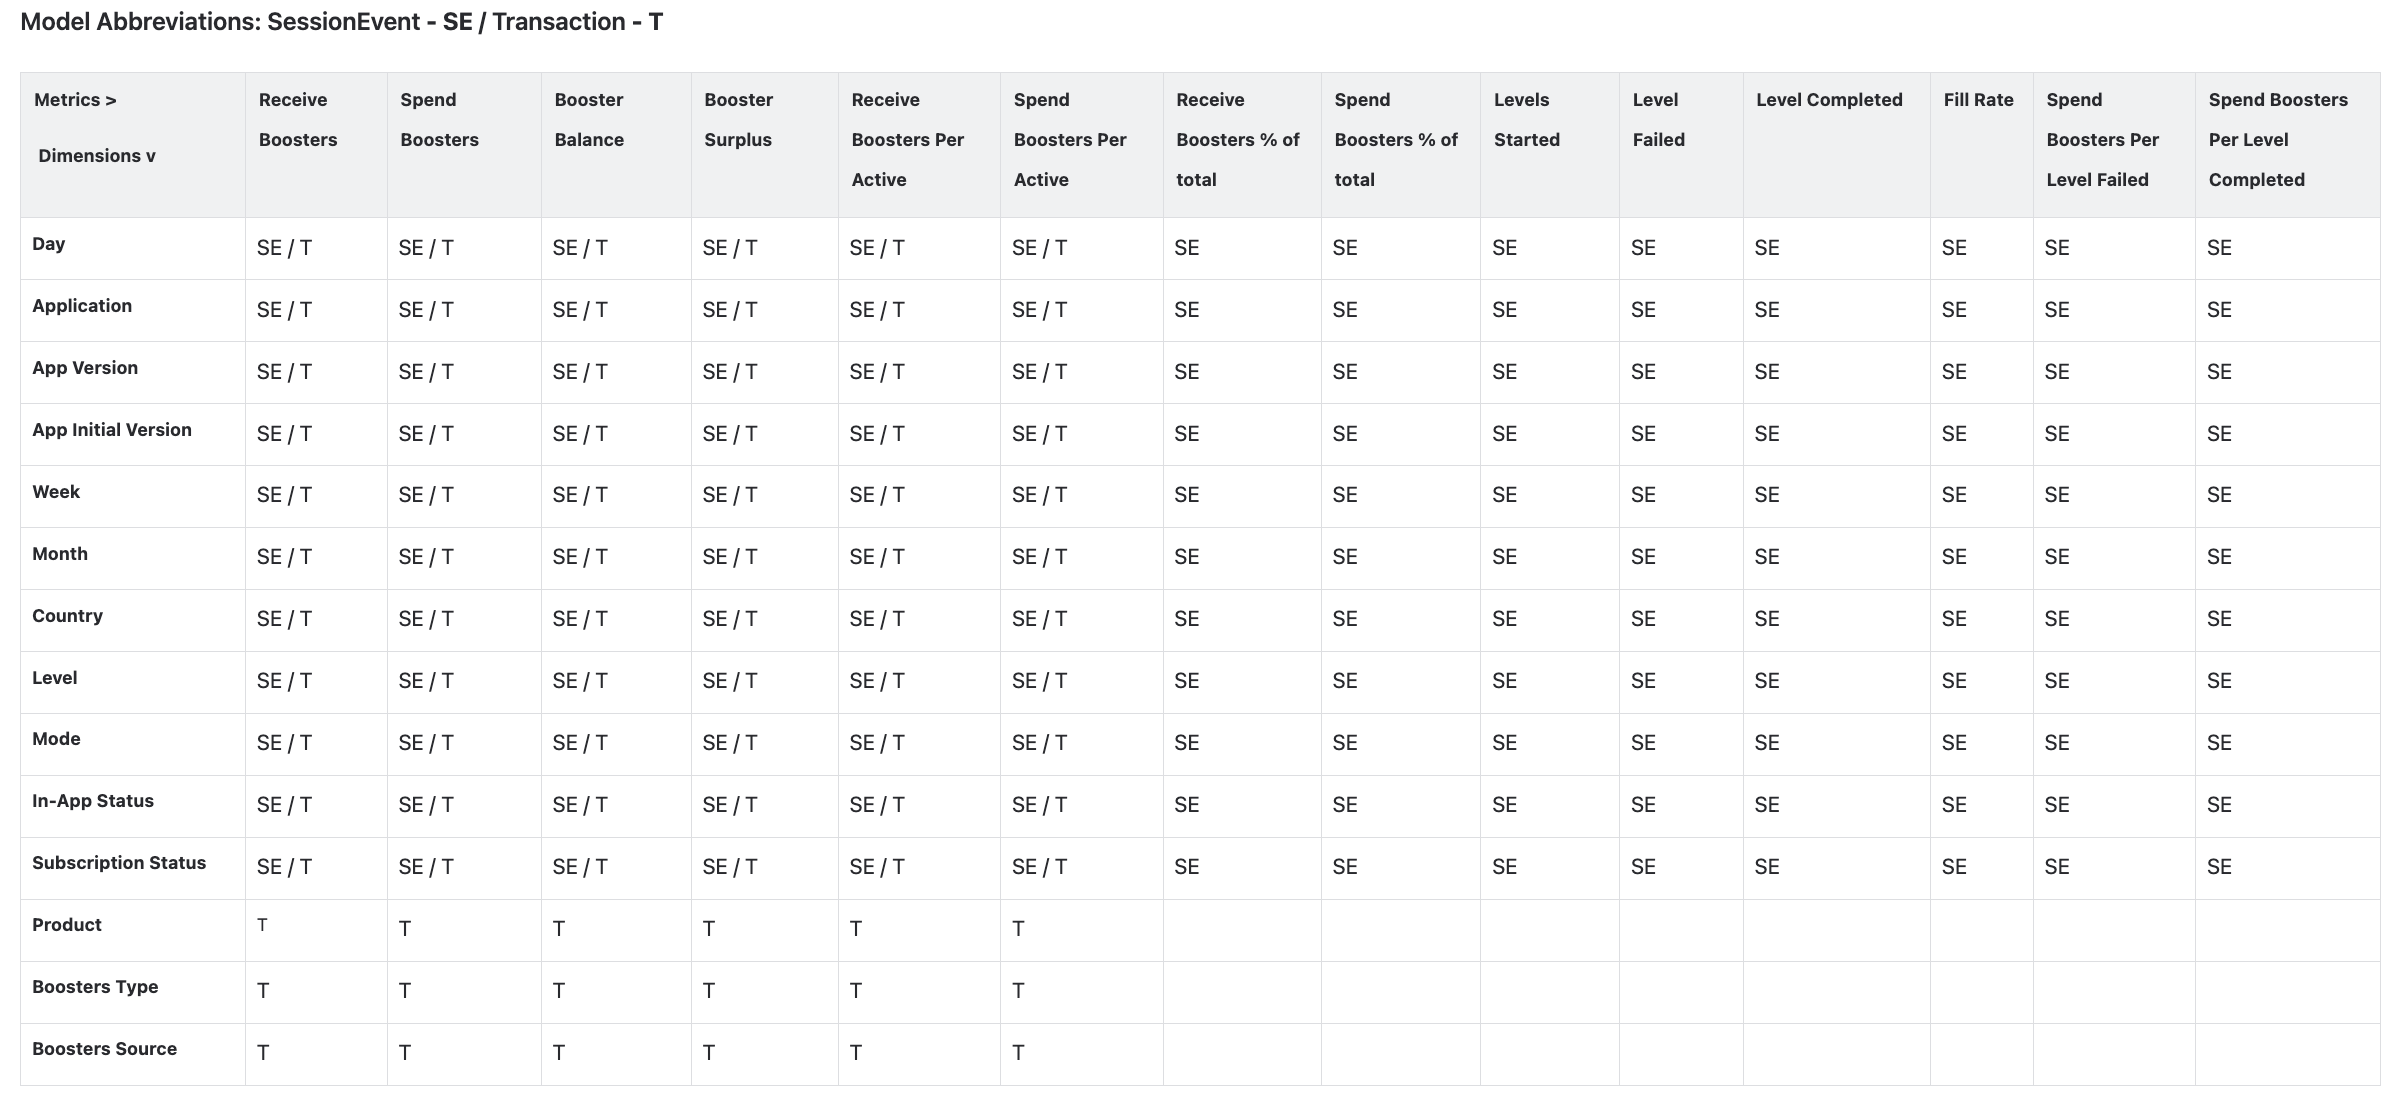
Metrics
Data Collection and Event Mapping Requirements
For this report to function correctly, SDK data transmission must be properly configured in the SessionEvent and Transaction models. This configuration is handled at the SDK integration level.
It is important to note that we cannot account for every possible event name defined by developers. To ensure accurate data collection, we rely on standardized event code names for event detection. The Comment column specifies the key terms we use in event names to extract the relevant metrics. The Model Name column indicates the specific SDK model where the data must be sent for metric tracking.
Transaction Model Event Processing
Event processing from the Transaction model is configured individually upon request. In this report, the system maps numeric values (1-10) to in-game currency names.
For example, in an application with two boosters — Star and Heart —we assign:
- Heart = Event 1
- Star = Event 2
As a result:
- The number of Hearts spent will be recorded in Spend Event 1.
- The number of Hearts received will be counted in Receive Event 1.
- The number of Stars spent will be recorded in Spend Event 2.
- The number of Stars received will be counted in Receive Event 2.
This mapping system ensures that in-game currency transactions are accurately tracked and reported based on predefined event codes.
Level Progress Dashboard
The Level Progress Dashboard provides insights into user progression across game levels. It enables tracking of player engagement, level completion rates, and potential drop-off points, helping optimize game balance and user experience.
- Update Frequency: Once per day
- Displayed Date Range: The dashboard shows a fixed range of the last 24 days plus the current day.
Level Progress Dashboard Widgets
The Level Progress Dashboard provides various widgets to analyze user progression, engagement, and level performance. Below is a detailed description of each widget, including its purpose, calculation rules, and limitations.
% Completed Levels to First Start
This widget calculates the percentage of users who started Level 1 on a given day and successfully completed the specified level. It helps analyze user engagement and identify levels where an abnormal drop-off occurs.
% Completed Levels to Started (+Avg)
This widget calculates the percentage of users who started a specific level on a given day and successfully completed it. It is useful for identifying difficult levels that may impact engagement.
Tutorial Completion Rate
This widget measures the percentage of users who completed each step of the tutorial compared to those who started it. It helps assess tutorial effectiveness and identify potential bottlenecks.
% Completed TLE Levels to First Start
This widget calculates the percentage of users who started Level 1 of a Time-Limited Event (TLE) on a given day and successfully completed the specified level. TLE modes include easter_tle, halloween_tle, etc.
% Completed TLE Levels to Started (+Avg)
Calculates the percentage of users who started a specific TLE level on a given day and successfully completed it. This helps evaluate the effectiveness of TLE levels.
Churn Rate, 1/ARPU Rate, Failed Rate
These metrics provide insights into player retention, revenue, and level difficulty.
Metric Definitions:
- Churn Rate:
(Total churned users) / (Total unique users) - 1/ARPU Rate:
1 / (Total revenue / Total unique users) - Failed Rate:
(Total failed attempts) / (Total successful completions)
Level Completed Events per DAU
This widget calculates how many levels are completed on average per Daily Active User (DAU). It helps determine whether players are progressing through levels or exiting the game early.