The Retention Report is designed to analyze and track how one-time users transition into loyal, long-term players over time. It helps you track how many users return to your application after their first interaction, providing valuable insights into user engagement and product stickiness.
This guide covers the core functionalities of the Retention Report, its key metrics, and how to interpret the data. By using this tool, you can analyze retention trends, identify areas for improvement, and make data-driven decisions to enhance long-term user engagement and retention strategies.
Report Objective: Retention Analysis
The objective of the Retention Report is to evaluate user retention and return rates. Retention is a metric that answers the question: how many users returned on Day X (Week X, Month X) after their first interaction with the product? It represents the number or percentage of returning users from the original cohort of new users.
This report helps assess how users continue to engage with the product over time.
Below is a detailed list of the primary filters and dimensions available in the report, each accompanied by a description to clarify its purpose and usage:
Filter and Dimension | Description |
|---|
App | Name of the application. |
Install Day | The day the application was installed. |
Install Week | The week the application was installed. |
Install Month | The month the application was installed. |
Media Source | The advertising source from which the user installed the application. |
Promo Campaign | Name of the promotional campaign (UA campaign). |
Adset | Name of the ad set (UA campaign). |
Ad | Name of the ad (UA Campaign). |
Device | Name of the device. |
Device Type | The type of device (e.g., iPhone, Android). |
Initial App Version | The version of the app downloaded by the user for the first time. |
Country | The user's country. |
Attribution Status | Attribution status: installed or reattributed. |
Paying Status | Indicates whether a user has made a purchase. Users are initially marked as "free" and transition to "paying" after completing their first transaction (in-app purchase, subscription, etc.). Important Notes: - The system checks whether a user has made a validated purchase only within the first 30 days after installation.
- This filter does not rely on inAppStatus or subscriptionStatus attributes \ features from the SDK events but instead verifies actual validated purchases.
Filters: - Free – Users who have not made a purchase.
- Paying (made a purchase within 30 days of install) – Users who completed a transaction within the first 30 days after installation.
Dimensions: - Free – Users who have not made a purchase.
- Paying (made a purchase within 30 days of install) – Users who completed a transaction within the first 30 days after installation.
This distinction ensures that filters allow broader segmentation, while dimensions focus on purchase behavior within a defined timeframe. |
Language | Language of the user's device. |
OS Version | The operating system version on the user's device. |
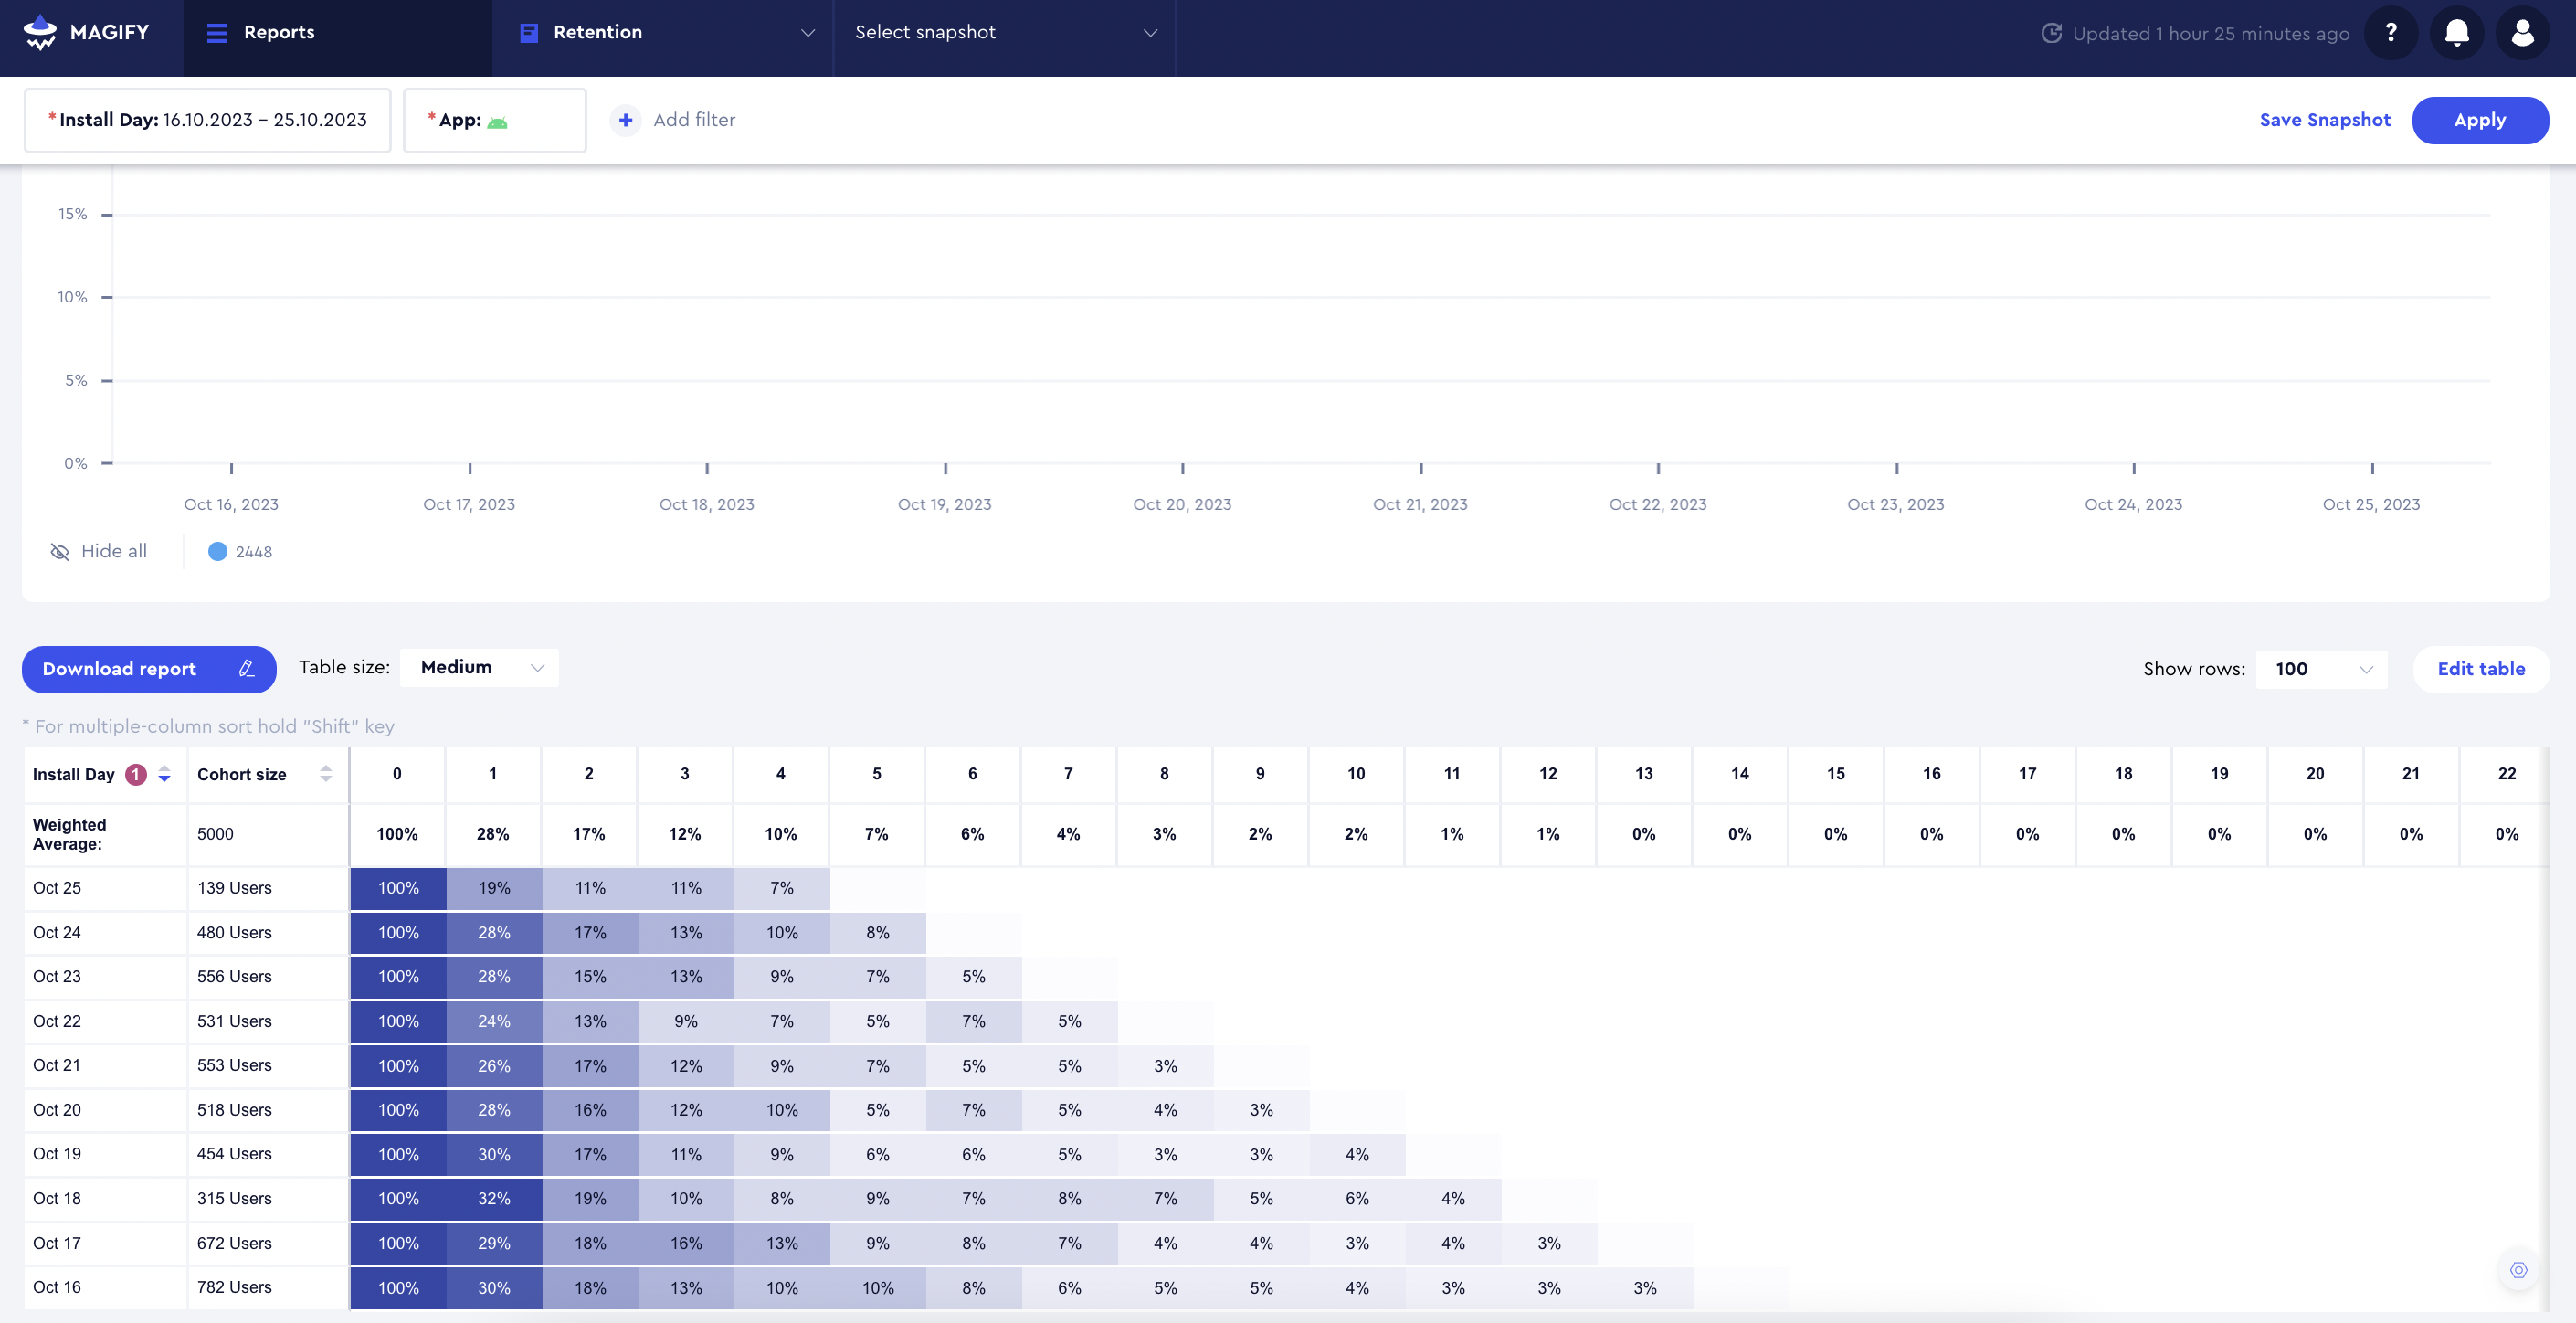
Day N Retention = (Users Day N / Users Day 0) * 100
Example:
In the chart above, Day 2 retention for the October 25 cohort is 11%, calculated as:
15/139*100 = 10,79%
Note: Magify and Adjust use different retention calculation methodologies.
- Magify: by calendar days (
Day 1 = the next calendar day after the install calendar day). - Adjust: in 24-hour periods starting from the exact install time. This may cause slight differences in reported retention metrics.
The Retention Report offers two data display modes:
- Rate Mode (as shown in the screenshot above): Displays retention as a percentage.
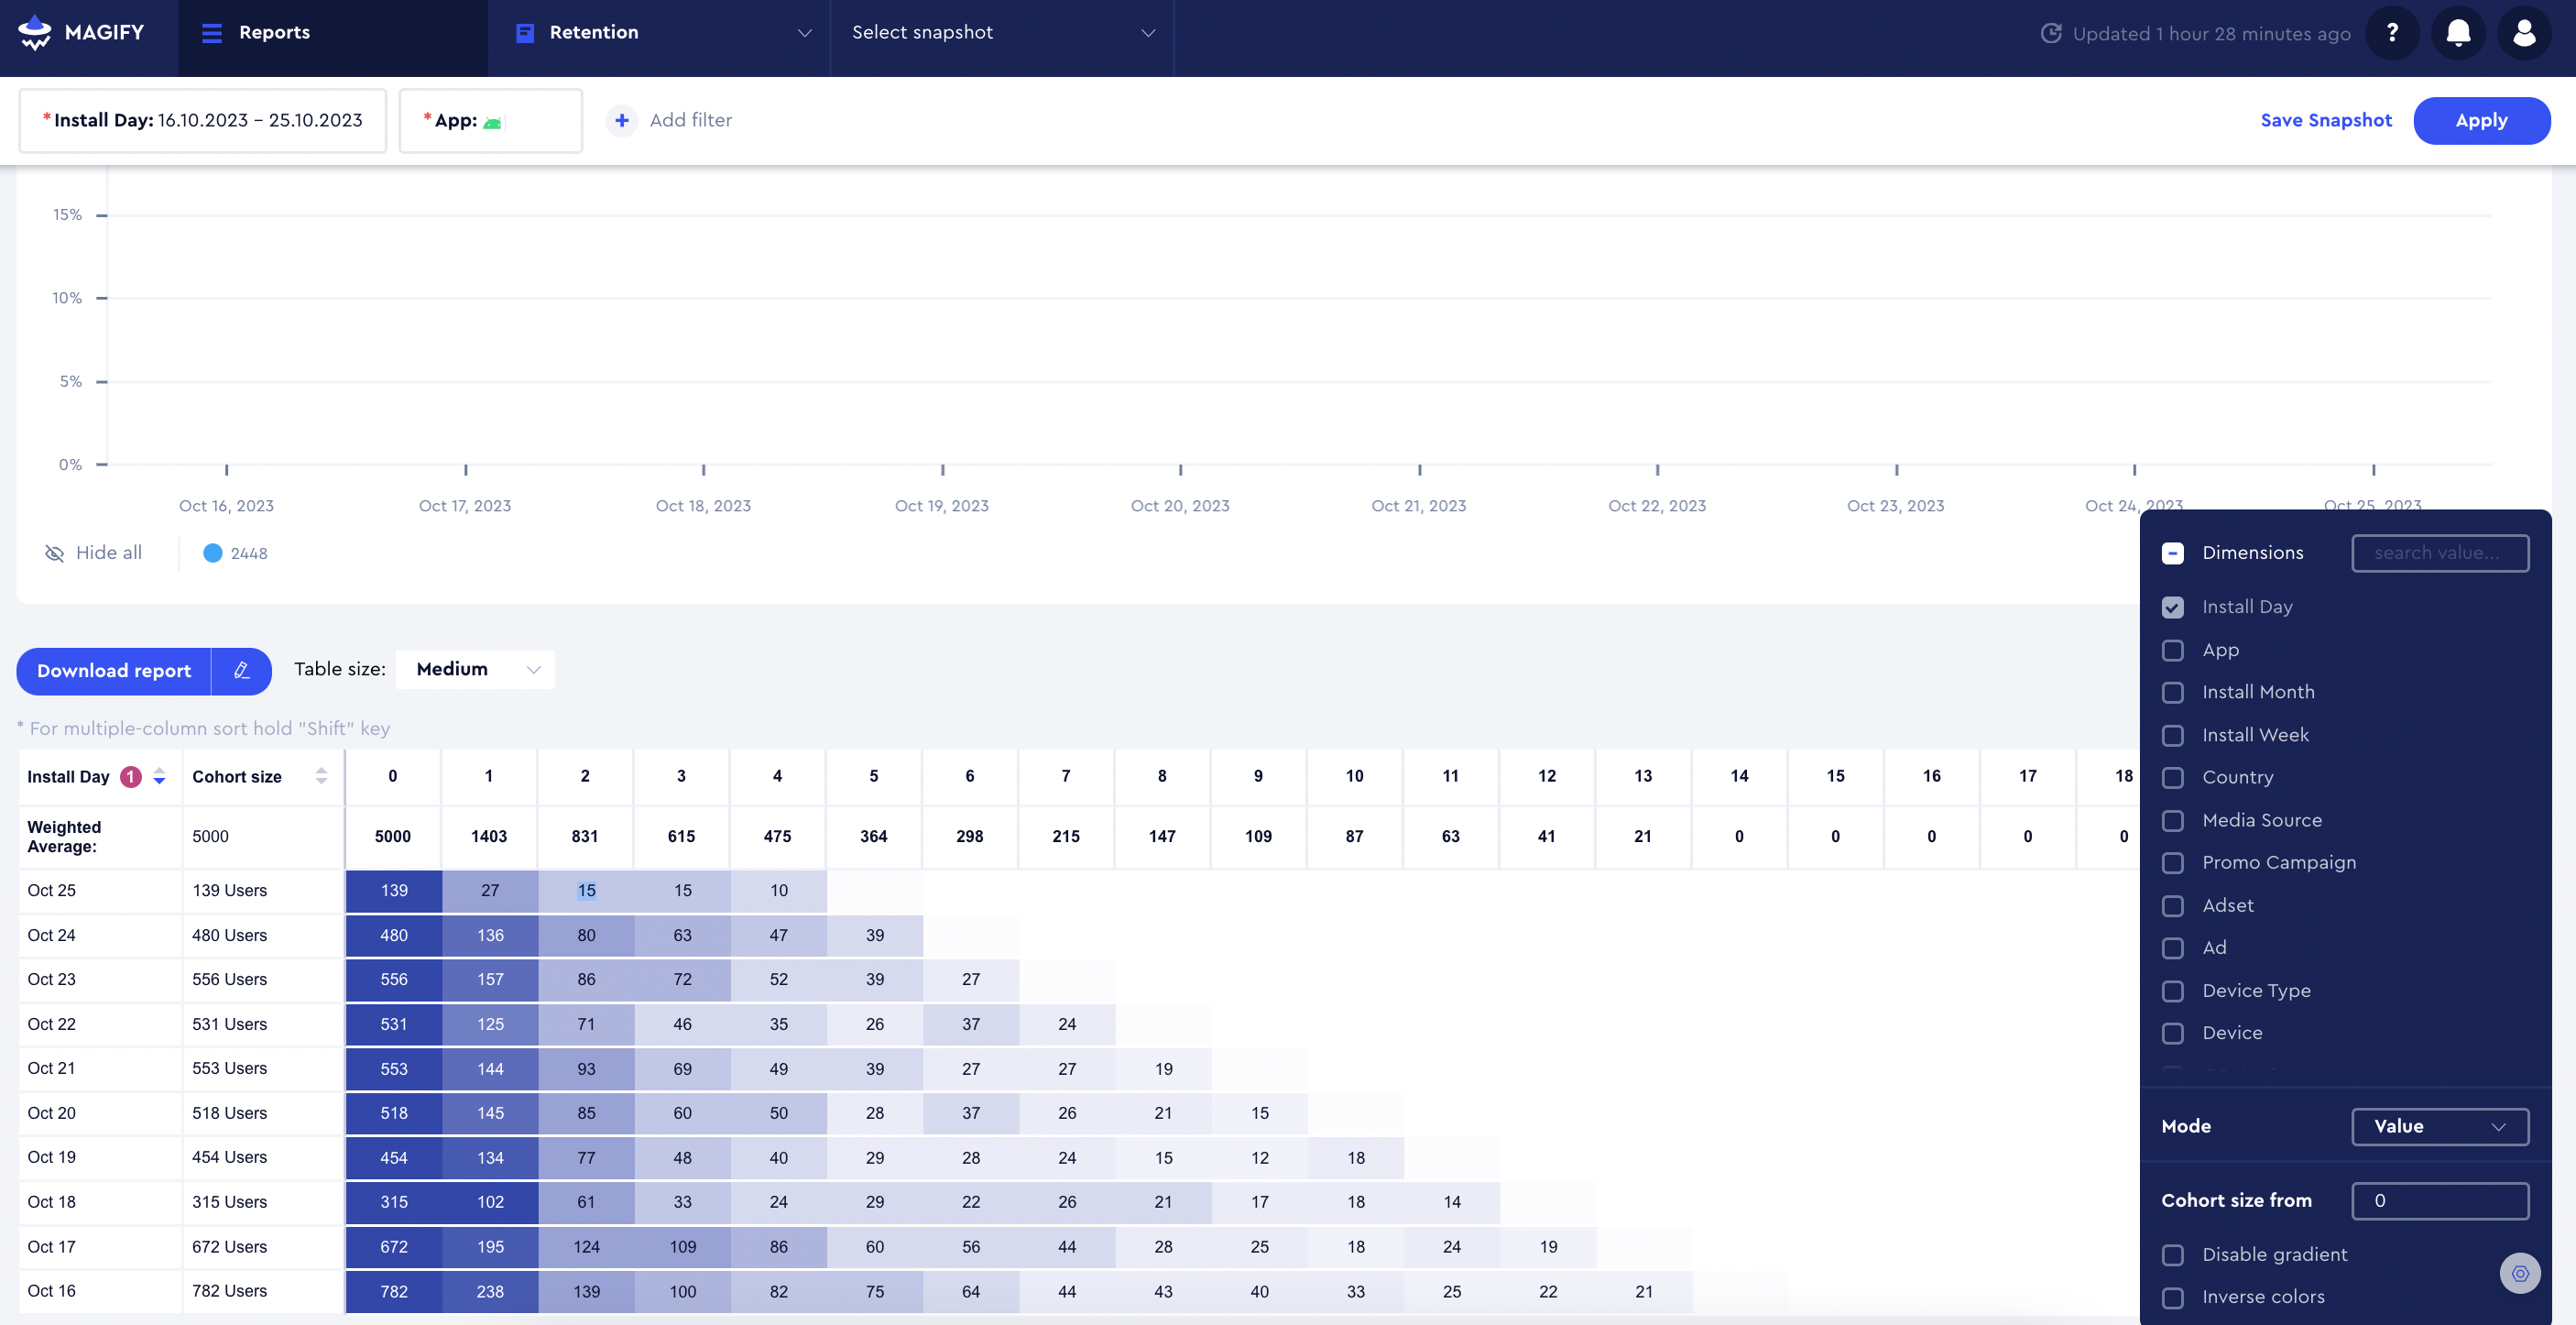
- Value Mode (as shown in the screenshot below): Displays the raw number of users.
Additionally, you can filter results based on cohort size using the Cohort Size From field for more precise analysis.
'%3e%3cpath%20d='M150.127%20195.325C233.04%20195.325%20300.255%20168.696%20300.255%20135.848C300.255%20103%20233.04%2076.3709%20150.127%2076.3709C67.2143%2076.3709%200%20103%200%20135.848C0%20168.696%2067.2143%20195.325%20150.127%20195.325Z'%20fill='white'/%3e%3cpath%20d='M231.093%20118.256L150.117%20-0.000183105L69.1527%20118.256C68.1365%20119.748%2067.5967%20121.294%2067.5967%20122.871C67.5967%20136.017%20104.538%20146.666%20150.117%20146.666C195.697%20146.666%20232.638%20136.007%20232.638%20122.871C232.638%20121.294%20232.098%20119.748%20231.082%20118.256H231.093Z'%20fill='%2301A9F2'/%3e%3cpath%20d='M150.106%20356.844L98.7265%20281.5L62.3035%20311.117L25.4253%20257.017L50.787%20239.721L68.8556%20266.226L105.279%20236.62L150.106%20302.363L194.934%20236.62L231.357%20266.226L270.045%20209.48L295.407%20226.776L237.898%20311.117L201.475%20281.5L150.106%20356.844Z'%20fill='white'/%3e%3cpath%20d='M592.168%20165.22V237.908H561.482V171.825C561.482%20153.884%20551.807%20143.034%20535.051%20143.034C516.644%20143.034%20505.318%20156.011%20505.318%20175.604V237.908H474.875V171.349C474.875%20153.407%20464.968%20142.791%20448.445%20142.791C429.804%20142.791%20418.711%20156.011%20418.711%20176.07V237.908H388.025V118.964H418.711V134.301C426.502%20122.033%20440.421%20115.418%20458.13%20115.418C477.014%20115.418%20490.7%20122.975%20498.247%20135.953C506.747%20123.208%20521.608%20115.418%20540.725%20115.418C572.819%20115.418%20592.179%20135.476%20592.179%20165.22H592.168Z'%20fill='white'/%3e%3cpath%20d='M899.48%2080.2534C899.48%2068.2182%20909.388%2059.4856%20920.248%2059.4856C931.574%2059.4856%20941.248%2068.9274%20941.248%2080.2534C941.248%2091.3465%20931.574%20100.788%20920.248%20100.788C909.155%20100.788%20899.48%2092.0557%20899.48%2080.2534Z'%20fill='white'/%3e%3cpath%20d='M935.832%20118.955H905.146V237.899H935.832V118.955Z'%20fill='white'/%3e%3cpath%20d='M1140.2%20118.955H1173L1099.84%20288.644H1067.5L1090.6%20237.666L1043.42%20118.955H1076.45L1107.37%20204.81L1140.18%20118.955H1140.2Z'%20fill='white'/%3e%3cpath%20d='M883.182%20115.418H815.904C781.45%20115.418%20755.008%20137.837%20755.008%20171.825C755.008%20206.756%20778.846%20228.466%20815.904%20228.466C831.951%20228.699%20847.288%20231.059%20847.288%20246.64C847.288%20259.617%20835.962%20267.175%20817.555%20267.175C799.148%20267.175%20784.985%20254.664%20781.915%20239.326L756.66%20246.873C763.741%20274.722%20787.346%20292.188%20817.312%20292.188C856.963%20292.188%20876.313%20272.838%20876.313%20249.233C876.313%20234.605%20869.231%20223.036%20855.545%20215.721C868.522%20206.047%20877.022%20190.709%20877.022%20171.825C877.022%20160.986%20871.412%20149.3%20863.145%20140.674H883.182V115.418ZM815.904%20203.919C797.264%20203.919%20782.392%20192.117%20782.392%20171.825C782.392%20151.534%20799.148%20139.964%20815.904%20139.964C832.66%20139.964%20849.416%20151.29%20849.416%20171.825C849.416%20188.814%20835.497%20203.919%20815.904%20203.919Z'%20fill='white'/%3e%3cpath%20d='M737.426%20237.906V118.962H708.158V136.088C698.685%20121.481%20682.796%20115.426%20668.983%20115.426C633.587%20115.426%20608.087%20143.509%20608.087%20179.148C608.087%20214.788%20633.1%20241.452%20668.03%20241.452C682.426%20241.452%20698.24%20235.08%20708.148%20220.917V237.906H737.415H737.426ZM673.471%20213.835C653.645%20213.835%20638.308%20199.207%20638.308%20178.429C638.308%20157.65%20653.889%20143.032%20673.704%20143.032C694.705%20143.032%20709.1%20160.021%20709.1%20178.429C709.1%20196.836%20694.472%20213.835%20673.46%20213.835H673.471Z'%20fill='white'/%3e%3cpath%20d='M1003.29%20111.085C1003.29%2098.5315%201011.17%2091.8842%201023.98%2091.8842C1028.9%2091.8842%201033.83%2092.6251%201037.77%2093.853L1042.2%2068.0043C1038.02%2066.7765%201027.43%2064.7971%201021.27%2064.7971C994.18%2064.7971%20972.607%2081.786%20972.607%20110.355V118.961H956.889V144.216H972.607V164.519V237.915H1003.29V144.216H1038.46V118.961H1003.29V111.096V111.085Z'%20fill='white'/%3e%3c/g%3e%3cdefs%3e%3cclipPath%20id='clip0_1_3'%3e%3crect%20width='1173'%20height='356.842'%20fill='white'/%3e%3c/clipPath%3e%3c/defs%3e%3c/svg%3e)