UA Cohort Report And Dashboard
Overview and Key Features
The UA Cohort Report and Dashboard provide detailed insights into user acquisition (UA) campaign performance by analyzing data segmented into cohorts based on the installation date. All data is collected for users who installed the application within a specified time period, ensuring an accurate cohort-based assessment.
The report is designed to evaluate UA campaign costs and results, with data updating for six months from the installation date. The dashboard complements the report by presenting key performance indicators (KPIs) in an interactive format, allowing for an in-depth analysis of acquisition effectiveness.
UA Cohort Report Features:
- User Acquisition Performance Tracking – Displays detailed statistics for UA campaigns, including cost, revenue, and retention metrics.
- Cohort-Based Data Analysis – Groups users based on their installation date, enabling a structured evaluation of campaign efficiency over time.
- Two Types of Metrics:
- Lifetime Cohort Metrics – Aggregated for the entire duration of the report.
- Fixed-Day Metrics – Collected for a specific number of days post-installation (e.g., D0, D4, D7, D30).
- Revenue Segmentation by Time Period:
- Total Revenue – The total revenue accumulated by the cohort during the report’s data collection period.
- D0 Revenue – Revenue generated on the day of installation.
- D30 Revenue – Revenue generated within the first 30 days post-installation.
UA Cohort Dashboard Features:
- Aggregated UA Campaign Overview – Displays essential acquisition KPIs in a centralized dashboard for streamlined analysis.
- Cohort Growth and Monetization Trends – Enables tracking of user behavior and revenue trends over time.
- Customizable Performance Analysis – Allows users to adjust filters and visualization settings to focus on specific cohorts or KPIs.
- Fixed-Day Data Drill-Down – Provides insights into user behavior on key milestone days (e.g., D0, D7, D30, D180).
- Campaign Optimization Insights – Highlights high-performing acquisition channels and regions, assisting in UA strategy refinement.
Together, these tools help marketers and analysts evaluate UA efficiency, optimize acquisition budgets, and improve monetization strategies based on real cohort data.
UA Cohort Report
Report Objective: The UA Cohort Report analyzes the performance of user acquisition (UA) campaigns, segmenting data into cohorts based on the installation date.
UA Cohort Report Variants:
- UA Cohort Short – Includes fixed-day metrics only up to D30, providing a concise view of short-term campaign performance.
- UA Cohort Long – Includes fixed-day metrics up to D180 (some up to D365). This report provides a long-term performance analysis but may run slower due to the volume of data.
Filters and Dimensions
Below is a detailed list of the primary filters and dimensions available in the report, each accompanied by a description to clarify its purpose and usage:
Metrics
General Metrics
General metrics are high-level aggregated indicators calculated for all users within a cohort. These metrics provide a comprehensive assessment of user acquisition performance and serve as a foundation for evaluating the overall effectiveness of UA campaigns.
Revenue Type Metrics
The metrics in this section are components of the aggregate metrics described in the previous section. For example:
Total Revenue = Ad Revenue + In-App Revenue + Subscription Revenue
These metrics are used to evaluate specific revenue sources and assess the effectiveness of different monetization strategies.
Use Case: UA Campaign Performance Monitoring and Optimization
The metrics and filters in these reports are designed for monitoring performance and optimizing user acquisition (UA) campaigns. The data analysis process consists of several key steps:
- High-Level Trend Analysis – Start by reviewing key metrics across days, weeks, and months to identify overall trends.
- Detailed Breakdown by Key Segments – Next, analyze performance by channel, campaign, and geo for deeper insights.
- Key Metrics– The most commonly used performance indicators include:
- Spend (total ad costs)
- CPI (cost per install)
- Cohort-based ARPU
- Cohort-based ROAS
- Retention rates
- Conversion to paying users
- Real-Time and Retrospective Analysis – Retrospective data analysis helps identify when significant performance changes occurred and link them to specific UA adjustments that impacted results.
Since UA campaigns follow a clear weekly seasonality pattern, analyzing data with a weekly breakdown is the most effective approach.
Example: Analyzing a UA Campaign for Higher-Quality Traffic
This example presents data from an ad campaign aimed at acquiring higher-quality traffic.
In the UA Predict Report, it is essential to correctly set return expectations:
- Target ROAS – Expected return on ad spend by day 150.
- Target Margin – Target profitability of +10%.
Additionally, in this case, the analysis includes organic traffic, which is selected in the Predict Model filter.
This approach enables flexible UA management, ROI forecasting, and the ability to evaluate the impact of different traffic sources on long-term performance.

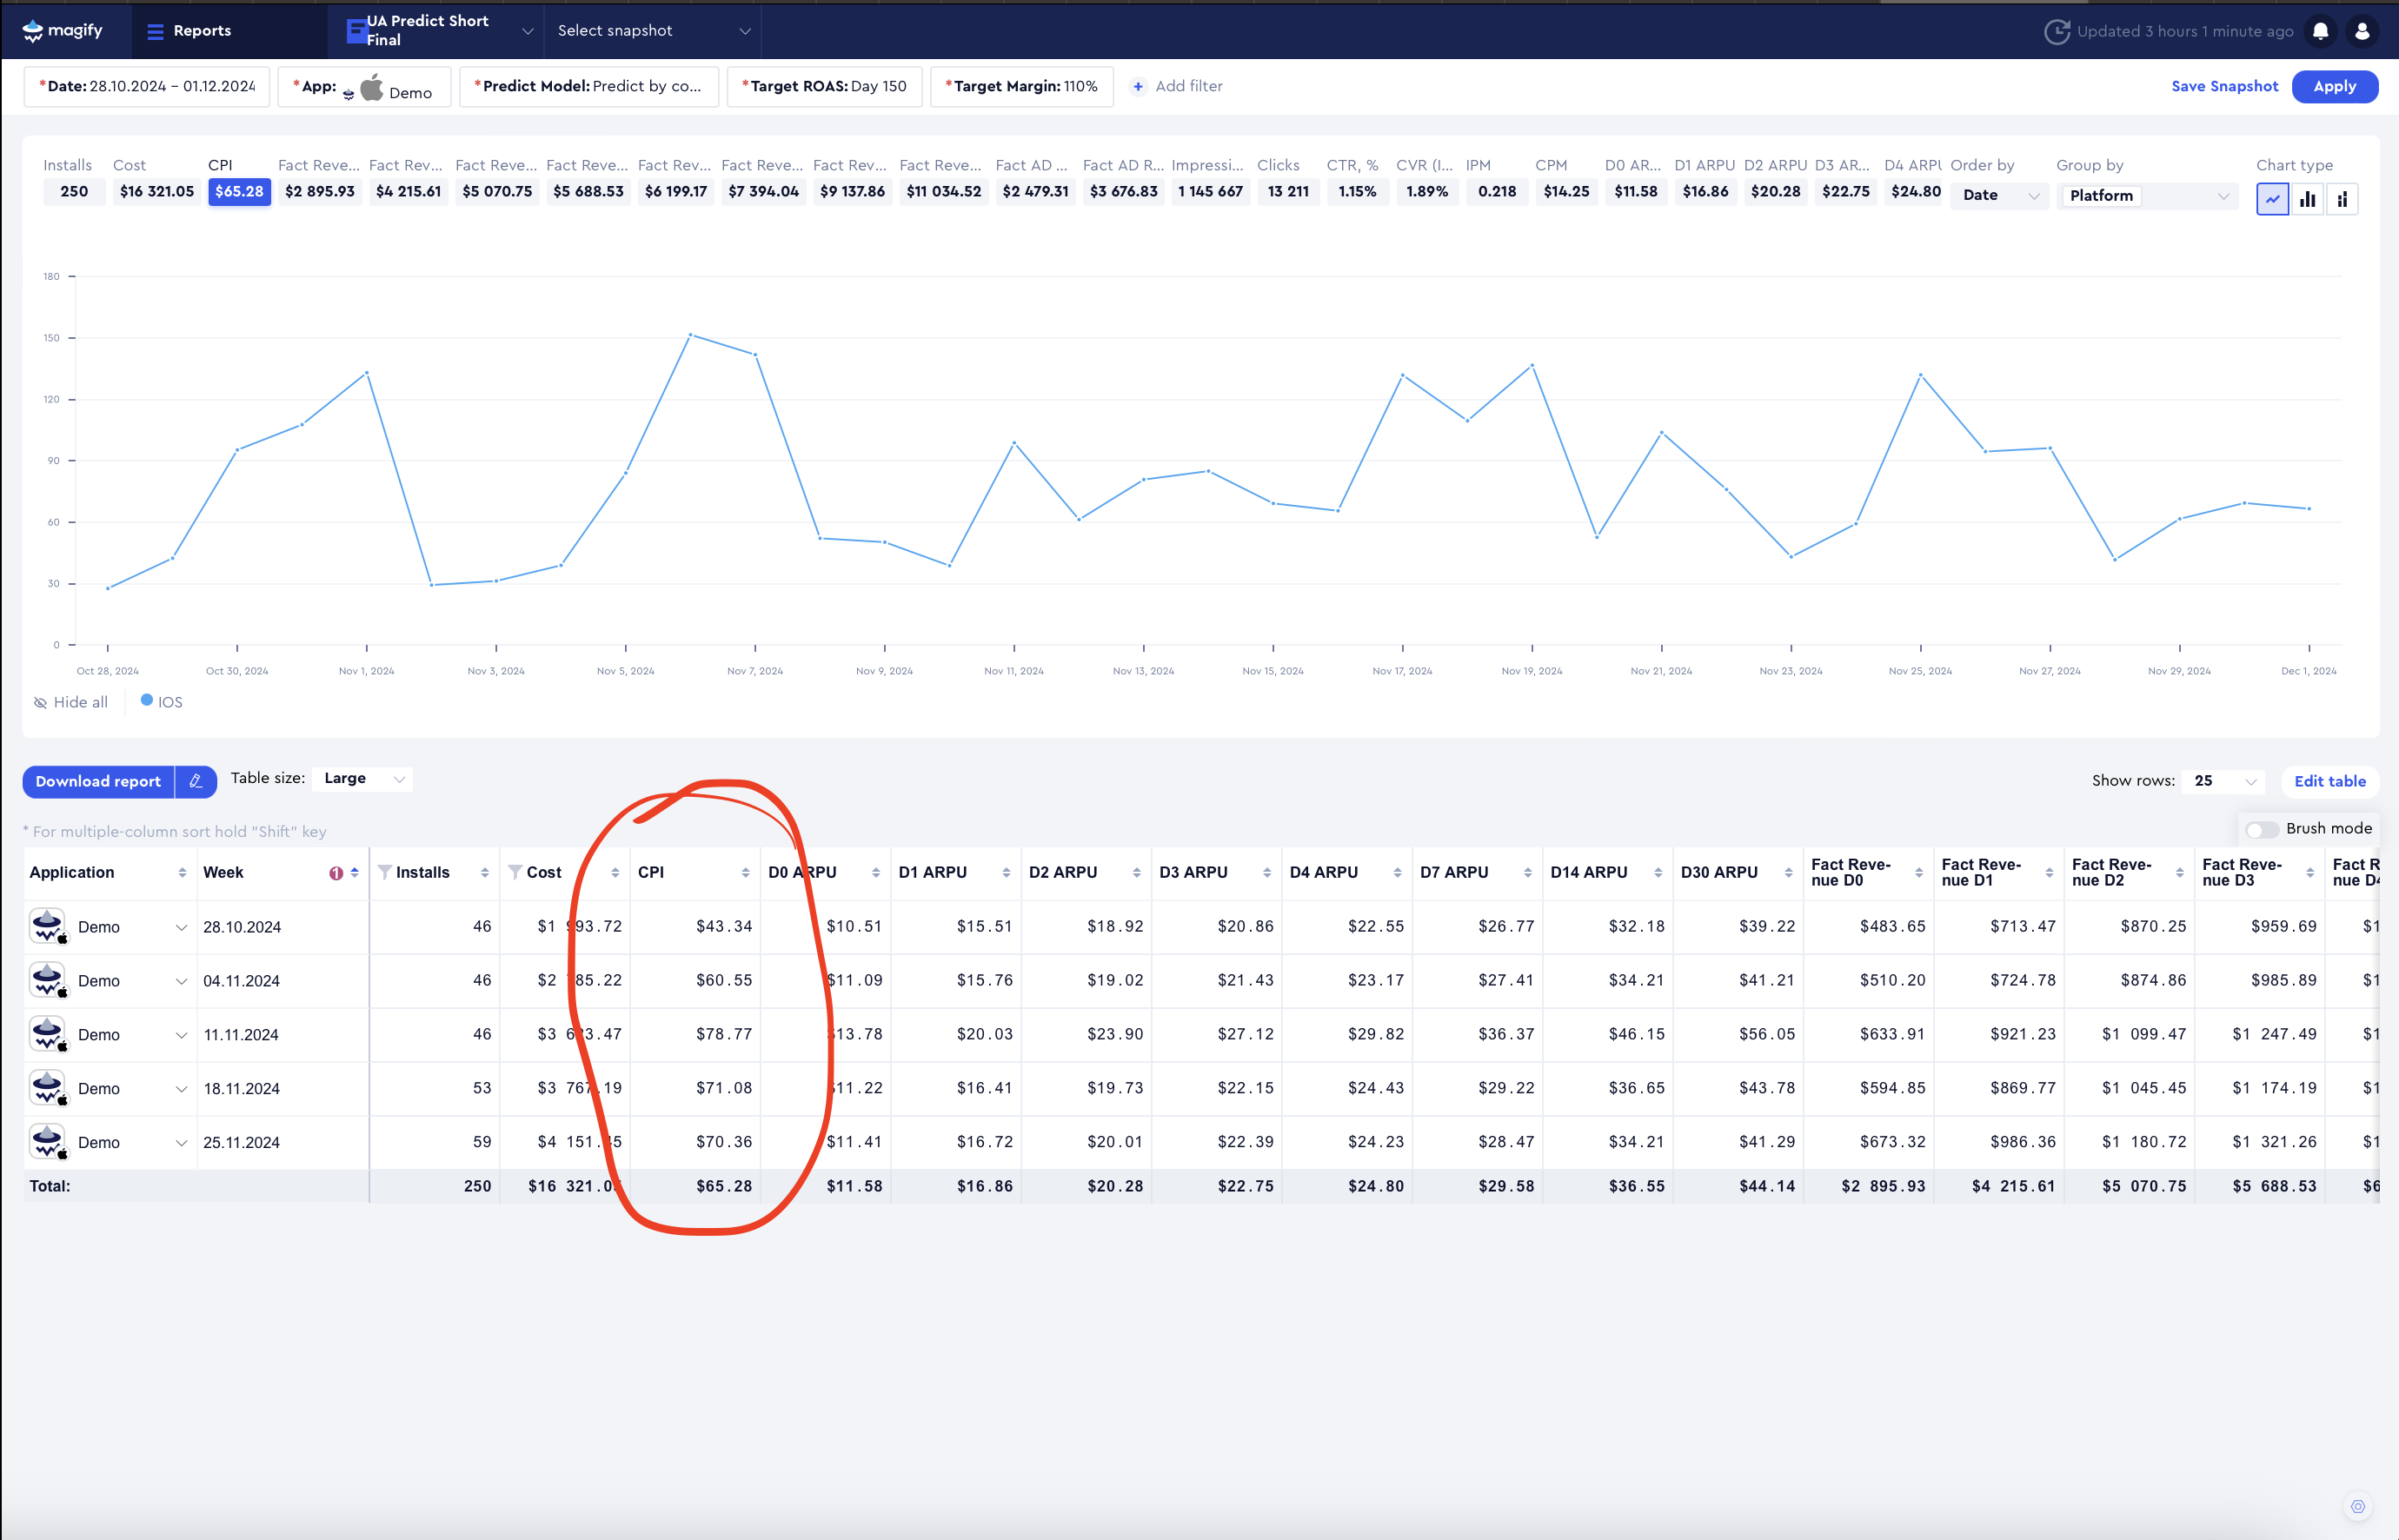
First, we analyze CPI. In November 2024, this app attempted to acquire more expensive traffic with the goal of improving its quality.

Analyzing ARPU and CPI Trends
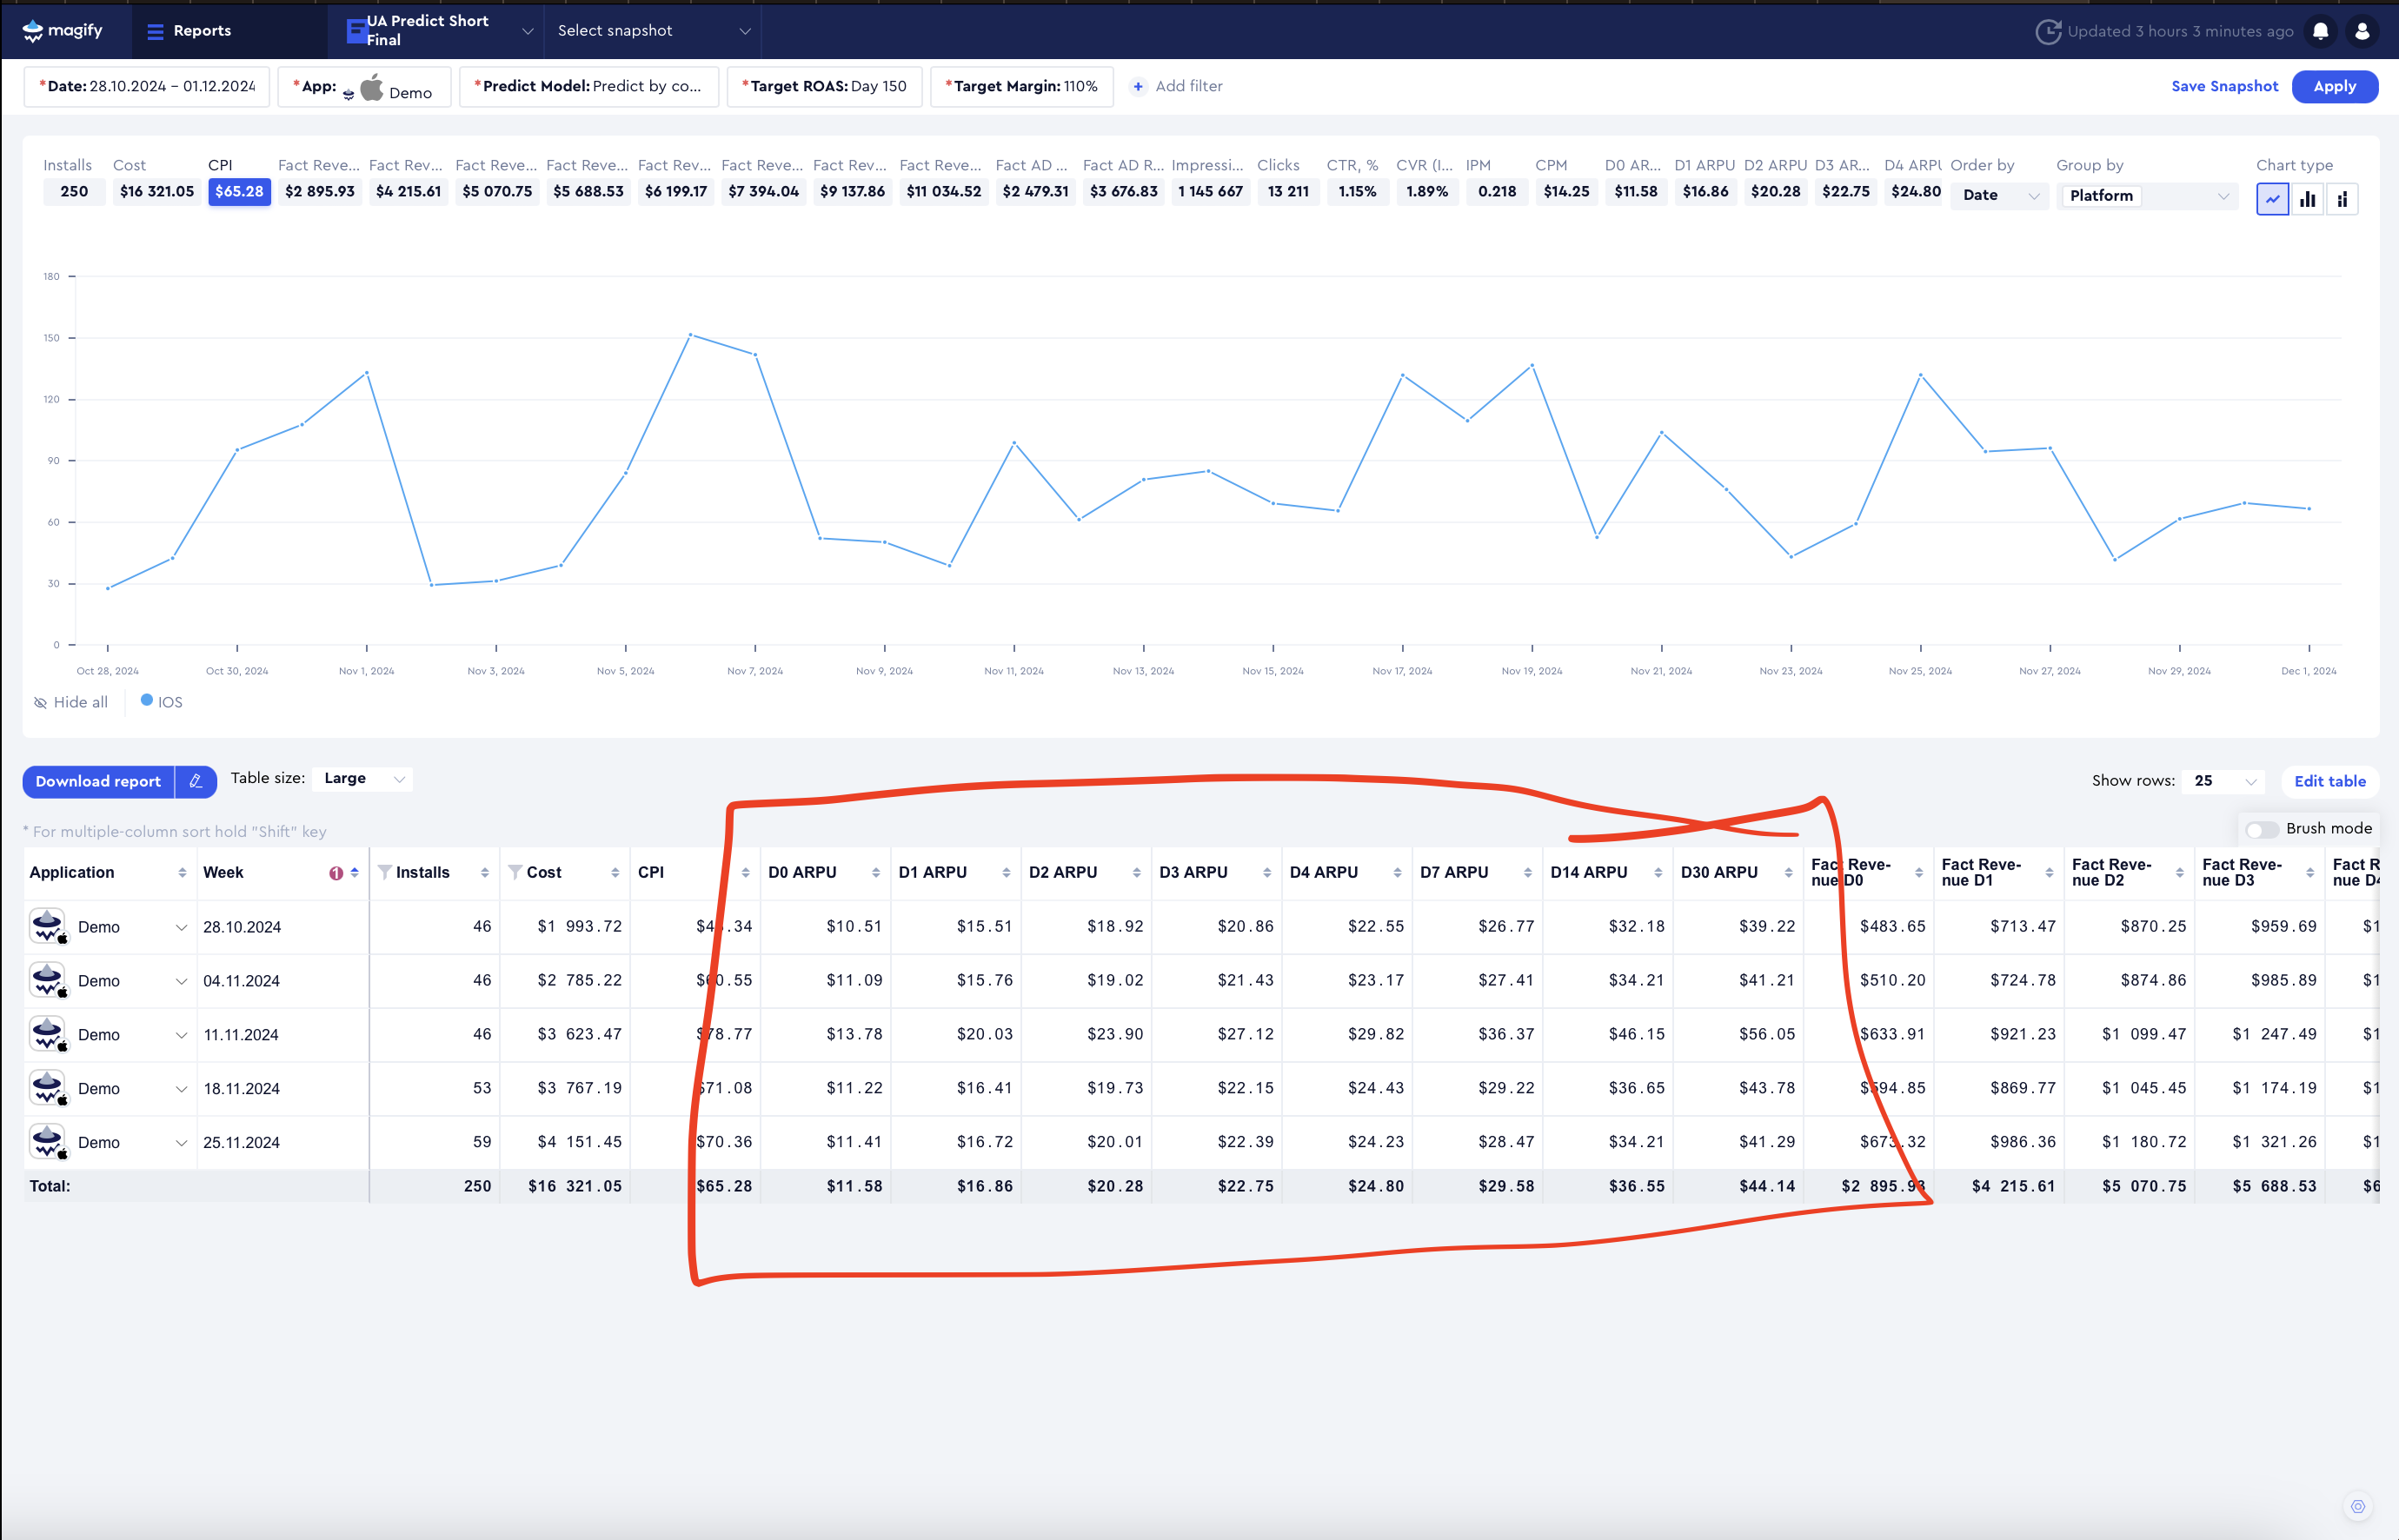
Looking at ARPU, we see that these users indeed generate higher average revenue.
- The weeks of October 28 and November 4 have a similar number of installs, but while CPI increased, ARPU across the entire funnel did not grow significantly. It seems that the increase in CPI was not necessarily due to attracting a different audience but rather just a CPI increase.
- Additional checks should be performed:
- Did IPM drop?
- Did the composition of acquired countries change?
- How did organic traffic distribution shift?
- It's also important to clarify when exactly UA campaign changes were made—was it midweek?
- Investigate whether UA network algorithms were adjusting due to traffic quality optimizations around this time.
The week of November 11 shows a clear qualitative difference in ARPU, but CPI during this period is significantly higher than in October.
- Beyond this point, ARPU differences compared to October become less pronounced, but CPI remains significantly different.
- This suggests that, in addition to attempts to improve traffic quality, there may have also been efforts to scale acquisition volumes.

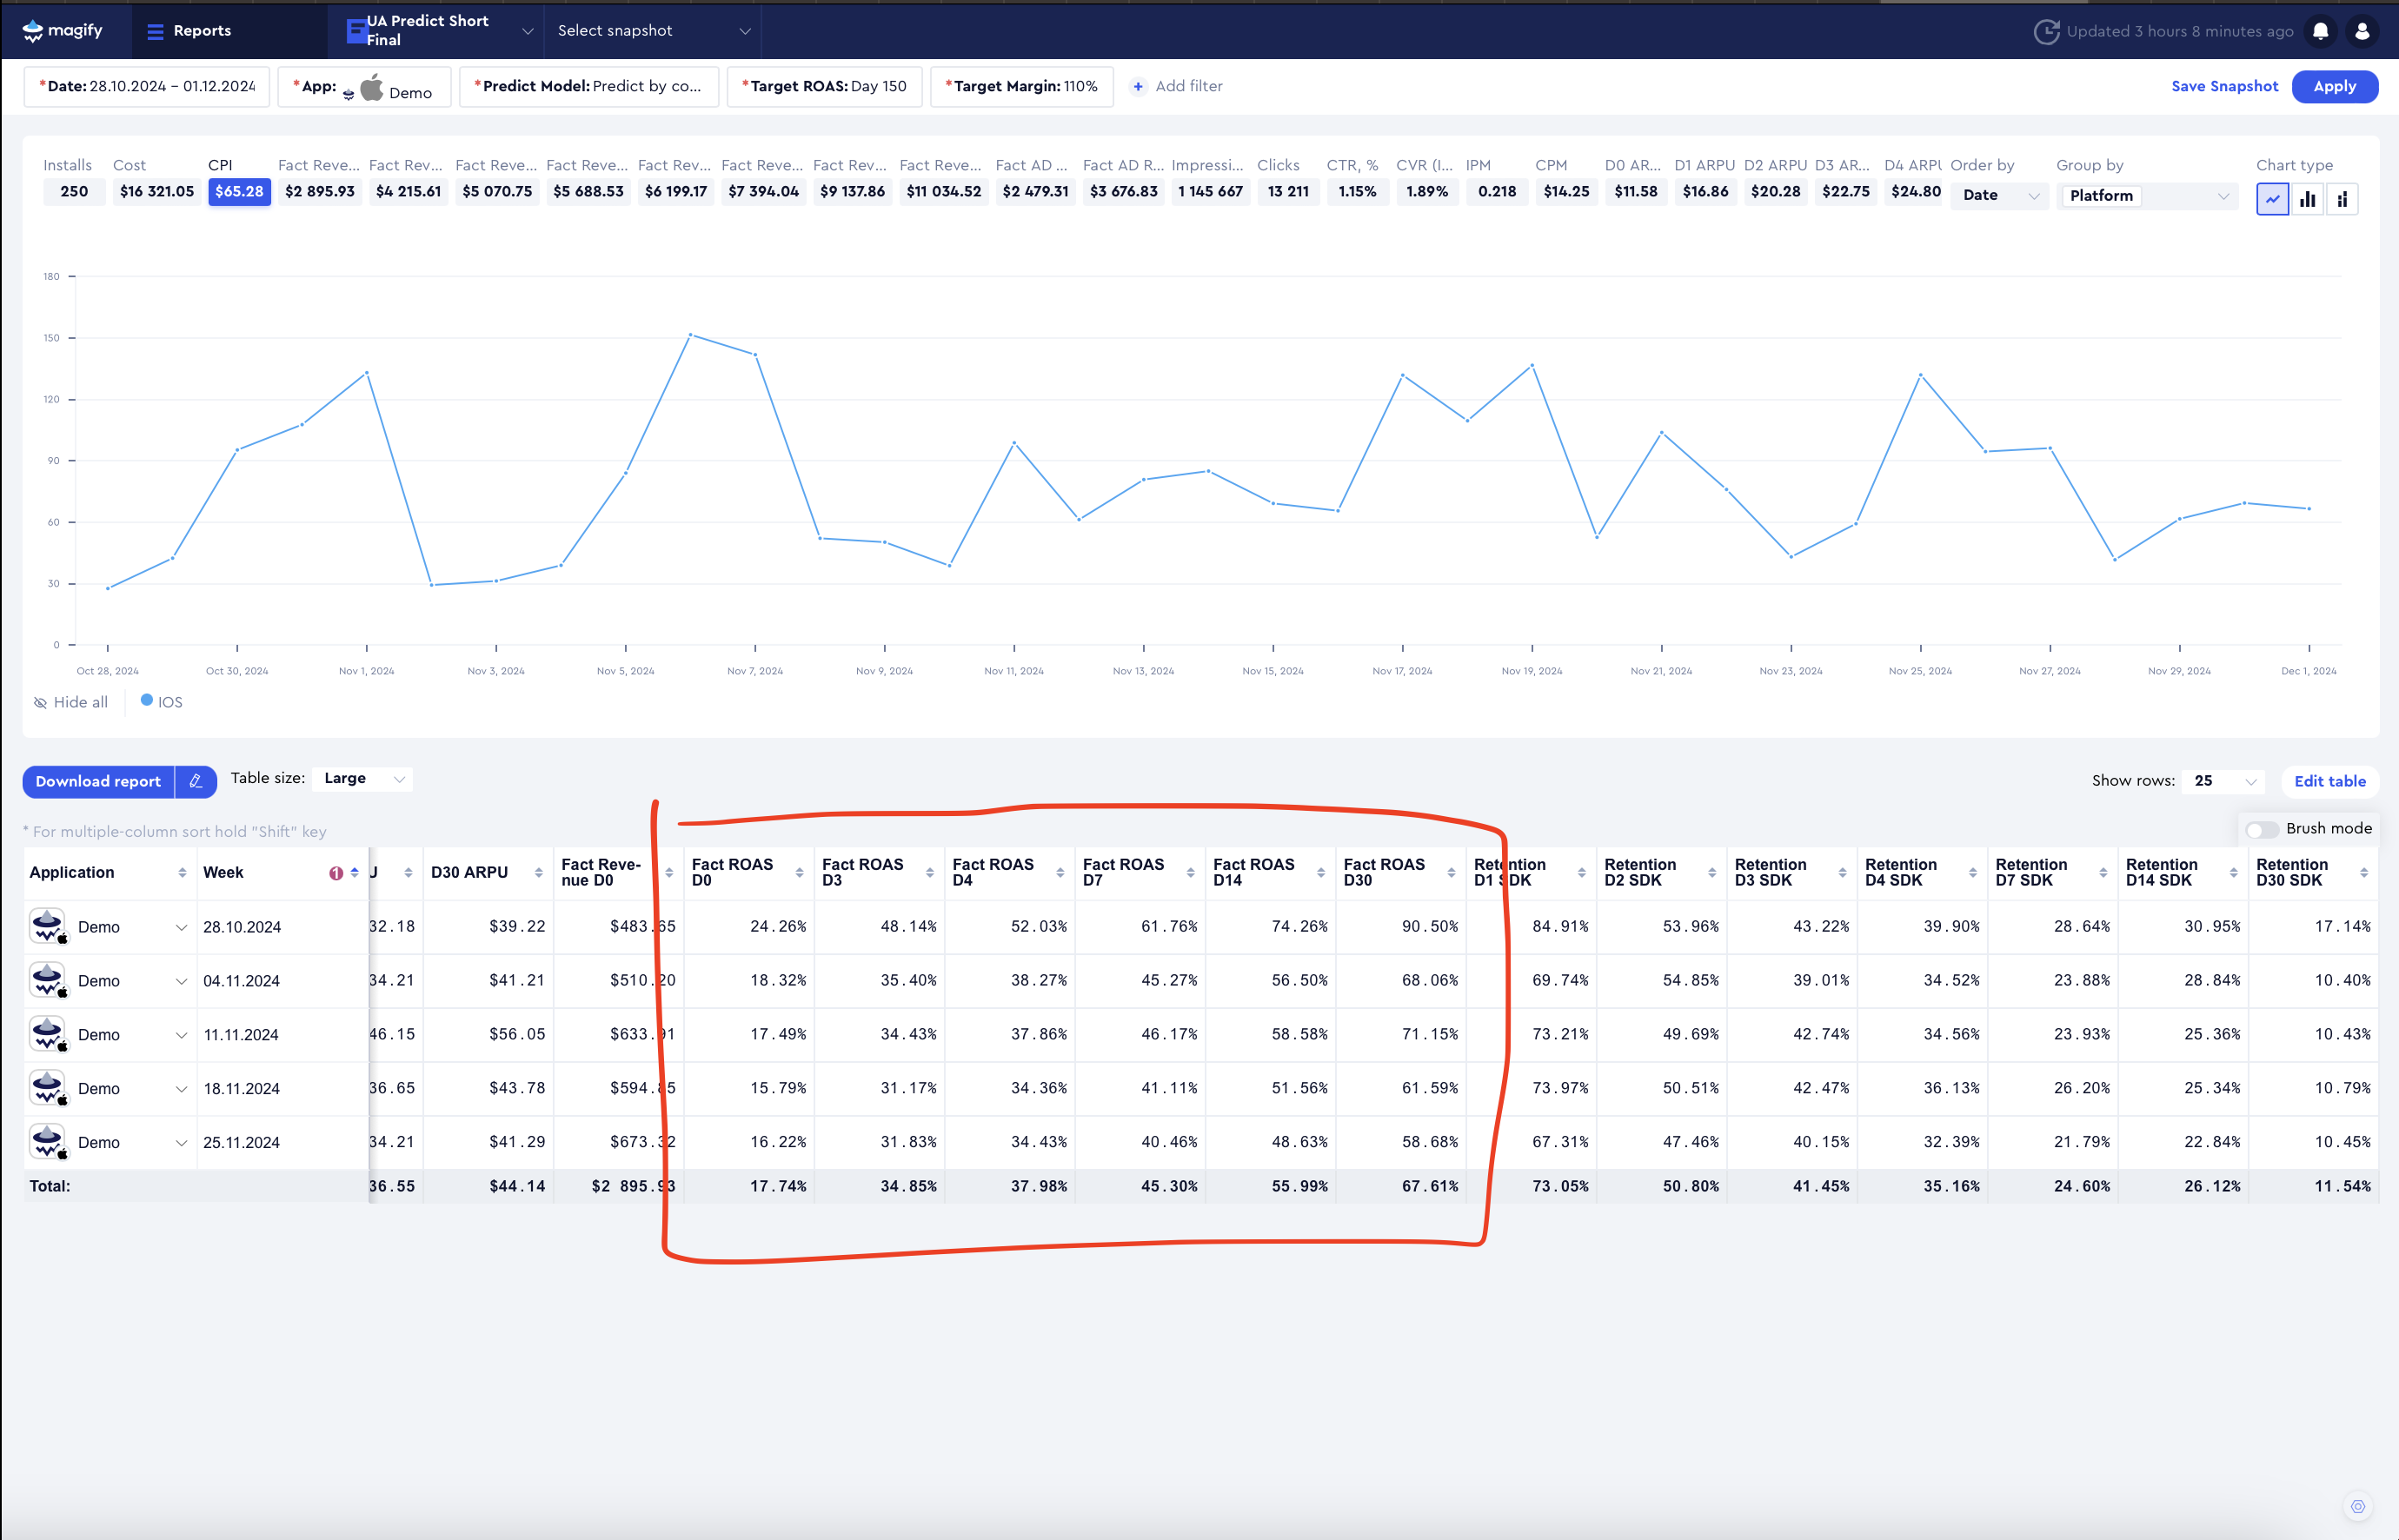
Next, we observe a decline in ROAS, which indicates that while the traffic quality improved in terms of average revenue per user, the increase in quality does not recompense for the higher acquisition costs.

Retention and Traffic Quality Assessment
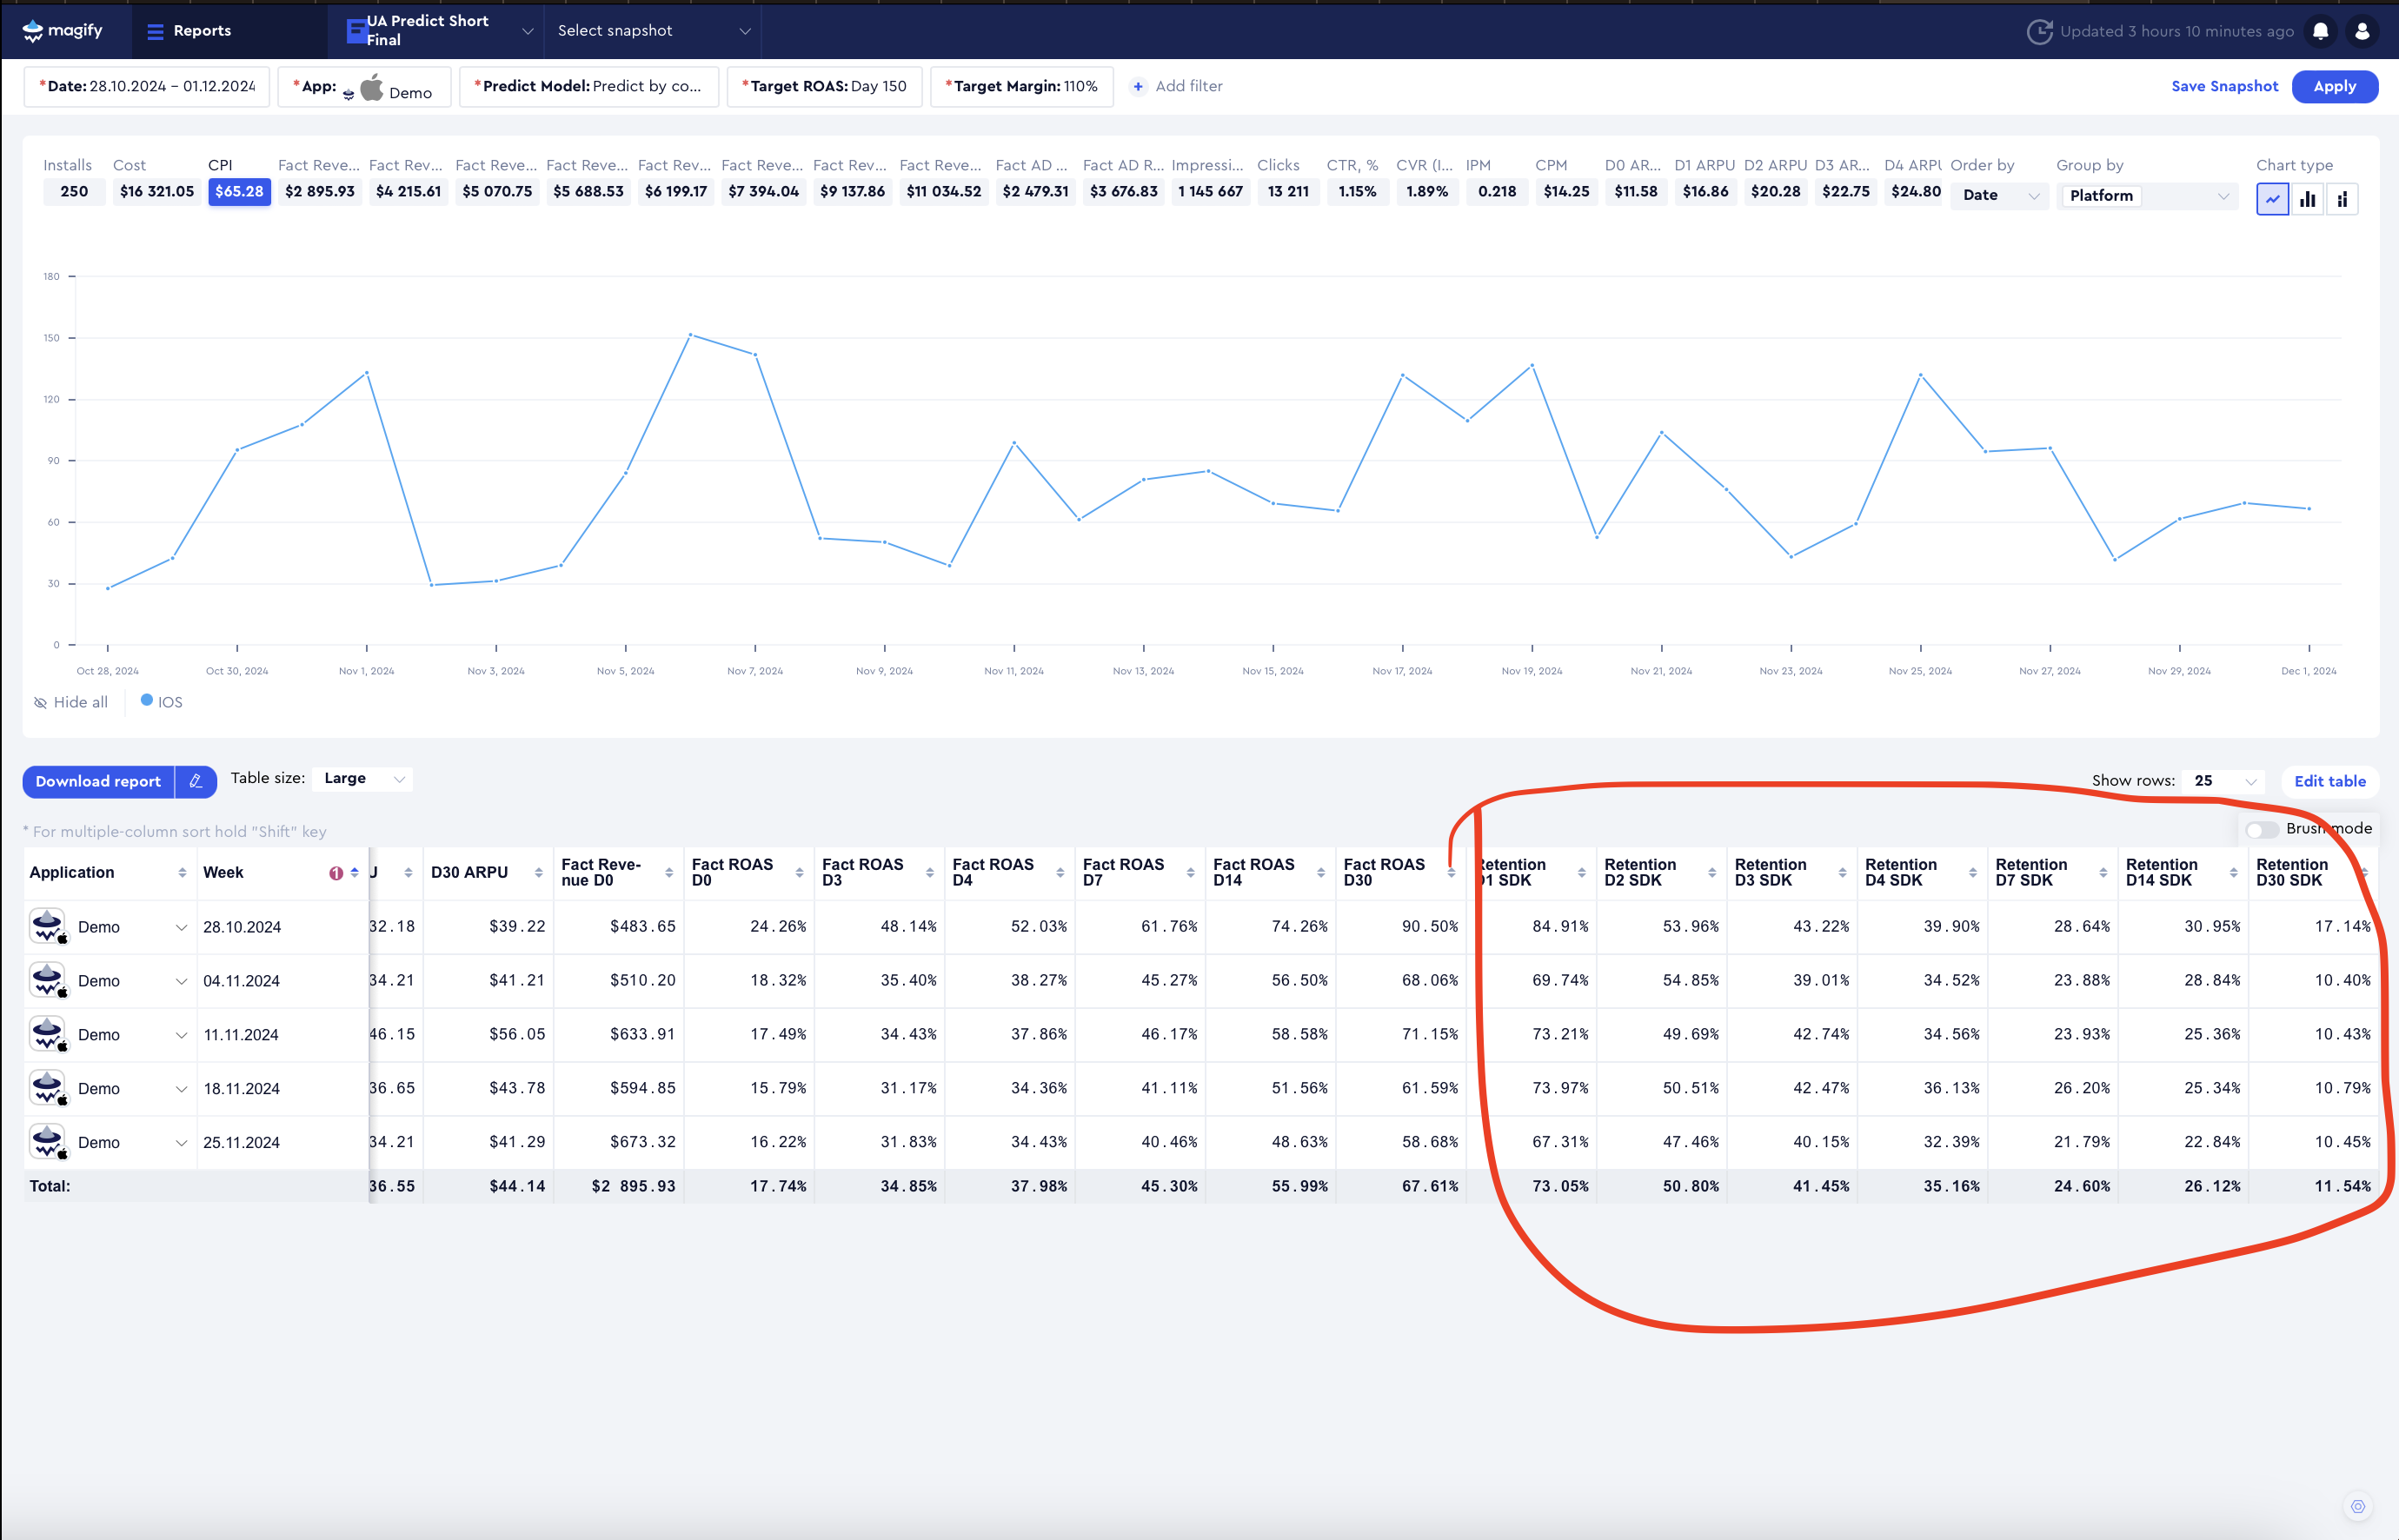
Looking at retention, we observe that these users are less loyal. Since this is an ad-monetized app (with no paid transactions), there is no expectation of long-term revenue growth from purchases. Instead, advertising revenue directly depends on high retention rates.
This leads to a key insight: In this case, improving traffic quality does not justify the increased acquisition costs, and alternative UA strategies should be explored.
Additional Considerations Before Making a Decision
Before finalizing any decisions, it is essential to check whether any external factors have changed, such as:
- Geo distribution
- Creative mix
- Campaign structure
For example, previously, optimization may have been focused solely on D7, while now D28 optimization has been added, leading to a restructuring of UA network algorithms. In such cases, performance during the algorithm adjustment period should not be used as a basis for decision-making.
Data Volume Consideration
Additionally, the number of installs in this example is quite low, making it difficult to draw reliable conclusions, even for experienced analysts.
- With this volume of installs, predictive models will not provide accurate results, as they require a larger dataset for meaningful projections.
Recommended Action: Revisiting the Strategy
The original goal of this experiment was to increase traffic quality. However, if higher-quality traffic does not justify the additional costs, it is advisable to revert to the October strategy and attempt to scale it.
- October's ROAS values appear to be very strong, making it a viable baseline for scaling.
- Scaling considerations: If the UA data shows a significant overperformance on ROAS by the target day, a more expensive acquisition strategy with lower short-term metrics at D30 might still be viable.
- If scaling is possible, it should be done gradually, ensuring that metrics remain stable after each scaling iteration.
By carefully monitoring performance at each stage, it becomes possible to balance acquisition volume and profitability, ensuring that traffic quality improvements align with sustainable revenue growth.