'%3e%3cpath%20d='M150.127%20195.325C233.04%20195.325%20300.255%20168.696%20300.255%20135.848C300.255%20103%20233.04%2076.3709%20150.127%2076.3709C67.2143%2076.3709%200%20103%200%20135.848C0%20168.696%2067.2143%20195.325%20150.127%20195.325Z'%20fill='white'/%3e%3cpath%20d='M231.093%20118.256L150.117%20-0.000183105L69.1527%20118.256C68.1365%20119.748%2067.5967%20121.294%2067.5967%20122.871C67.5967%20136.017%20104.538%20146.666%20150.117%20146.666C195.697%20146.666%20232.638%20136.007%20232.638%20122.871C232.638%20121.294%20232.098%20119.748%20231.082%20118.256H231.093Z'%20fill='%2301A9F2'/%3e%3cpath%20d='M150.106%20356.844L98.7265%20281.5L62.3035%20311.117L25.4253%20257.017L50.787%20239.721L68.8556%20266.226L105.279%20236.62L150.106%20302.363L194.934%20236.62L231.357%20266.226L270.045%20209.48L295.407%20226.776L237.898%20311.117L201.475%20281.5L150.106%20356.844Z'%20fill='white'/%3e%3cpath%20d='M592.168%20165.22V237.908H561.482V171.825C561.482%20153.884%20551.807%20143.034%20535.051%20143.034C516.644%20143.034%20505.318%20156.011%20505.318%20175.604V237.908H474.875V171.349C474.875%20153.407%20464.968%20142.791%20448.445%20142.791C429.804%20142.791%20418.711%20156.011%20418.711%20176.07V237.908H388.025V118.964H418.711V134.301C426.502%20122.033%20440.421%20115.418%20458.13%20115.418C477.014%20115.418%20490.7%20122.975%20498.247%20135.953C506.747%20123.208%20521.608%20115.418%20540.725%20115.418C572.819%20115.418%20592.179%20135.476%20592.179%20165.22H592.168Z'%20fill='white'/%3e%3cpath%20d='M899.48%2080.2534C899.48%2068.2182%20909.388%2059.4856%20920.248%2059.4856C931.574%2059.4856%20941.248%2068.9274%20941.248%2080.2534C941.248%2091.3465%20931.574%20100.788%20920.248%20100.788C909.155%20100.788%20899.48%2092.0557%20899.48%2080.2534Z'%20fill='white'/%3e%3cpath%20d='M935.832%20118.955H905.146V237.899H935.832V118.955Z'%20fill='white'/%3e%3cpath%20d='M1140.2%20118.955H1173L1099.84%20288.644H1067.5L1090.6%20237.666L1043.42%20118.955H1076.45L1107.37%20204.81L1140.18%20118.955H1140.2Z'%20fill='white'/%3e%3cpath%20d='M883.182%20115.418H815.904C781.45%20115.418%20755.008%20137.837%20755.008%20171.825C755.008%20206.756%20778.846%20228.466%20815.904%20228.466C831.951%20228.699%20847.288%20231.059%20847.288%20246.64C847.288%20259.617%20835.962%20267.175%20817.555%20267.175C799.148%20267.175%20784.985%20254.664%20781.915%20239.326L756.66%20246.873C763.741%20274.722%20787.346%20292.188%20817.312%20292.188C856.963%20292.188%20876.313%20272.838%20876.313%20249.233C876.313%20234.605%20869.231%20223.036%20855.545%20215.721C868.522%20206.047%20877.022%20190.709%20877.022%20171.825C877.022%20160.986%20871.412%20149.3%20863.145%20140.674H883.182V115.418ZM815.904%20203.919C797.264%20203.919%20782.392%20192.117%20782.392%20171.825C782.392%20151.534%20799.148%20139.964%20815.904%20139.964C832.66%20139.964%20849.416%20151.29%20849.416%20171.825C849.416%20188.814%20835.497%20203.919%20815.904%20203.919Z'%20fill='white'/%3e%3cpath%20d='M737.426%20237.906V118.962H708.158V136.088C698.685%20121.481%20682.796%20115.426%20668.983%20115.426C633.587%20115.426%20608.087%20143.509%20608.087%20179.148C608.087%20214.788%20633.1%20241.452%20668.03%20241.452C682.426%20241.452%20698.24%20235.08%20708.148%20220.917V237.906H737.415H737.426ZM673.471%20213.835C653.645%20213.835%20638.308%20199.207%20638.308%20178.429C638.308%20157.65%20653.889%20143.032%20673.704%20143.032C694.705%20143.032%20709.1%20160.021%20709.1%20178.429C709.1%20196.836%20694.472%20213.835%20673.46%20213.835H673.471Z'%20fill='white'/%3e%3cpath%20d='M1003.29%20111.085C1003.29%2098.5315%201011.17%2091.8842%201023.98%2091.8842C1028.9%2091.8842%201033.83%2092.6251%201037.77%2093.853L1042.2%2068.0043C1038.02%2066.7765%201027.43%2064.7971%201021.27%2064.7971C994.18%2064.7971%20972.607%2081.786%20972.607%20110.355V118.961H956.889V144.216H972.607V164.519V237.915H1003.29V144.216H1038.46V118.961H1003.29V111.096V111.085Z'%20fill='white'/%3e%3c/g%3e%3cdefs%3e%3cclipPath%20id='clip0_1_3'%3e%3crect%20width='1173'%20height='356.842'%20fill='white'/%3e%3c/clipPath%3e%3c/defs%3e%3c/svg%3e)

Ads Monetization Report and Dashboard
Overview and Key Features
The Ads Monetization Report and Dashboard provide detailed insights into the performance of ad networks, enabling an evaluation of monetization effectiveness. The report uses data pulled directly from ad network dashboards via APIs (Monetization Grabbers), ensuring accurate statistics tracked by the networks themselves. The dashboard complements the report by presenting key metrics to assess ad performance and monetization efficiency. Together, these tools empower data-driven decision-making and help optimize advertising revenue. Key features include:
Ads Monetization Report Features:
- Ad Network Performance Tracking – Provides detailed metrics for analyzing the performance of individual ad networks.
- Real Ad Network Data – Uses data directly from ad network dashboards via APIs (Monetization Grabbers) for accurate and reliable statistics.
- Revenue Analysis – Offers insights into revenue generated from banners, interstitials, rewarded ads, and other monetization sources.
- CPM and Impressions Insights – Tracks effective CPMs and ad impressions across various networks and campaigns.
- Granular Segmentation – Enables filtering by ad networks, regions, ad formats, and time periods.
Ads Monetization Dashboard Features:
- Aggregated Performance Overview – Displays key monetization metrics in a centralized dashboard for easy analysis.
- Cumulative Revenue View – Allows tracking of revenue growth over time, providing insights into trends and long-term performance.
- Customizable Data Display – Users can adjust the dashboard to display the most relevant key performance indicators for their needs.
- Interactive Data Drill-Down – Offers detailed exploration of ad performance by source, format, and other dimensions.
- Optimization Guidance – Helps refine ad monetization strategies by highlighting high-performing networks and formats.
Ads Monetization Report
Report Objective: The Ads Monetization Report is designed to analyze the performance of ad networks and evaluate monetization effectiveness. The report pulls data directly from ad network dashboards via APIs (Monetization Grabbers), ensuring accurate and reliable metrics tracked by the networks themselves. This enables a detailed evaluation of revenue, impressions, and CPM trends, helping to identify the most effective ad sources and formats for maximizing monetization outcomes.
Data Source and Ad Waterfall Explanation
Data Source in This Report
The data in this report is sourced directly from ad network dashboards via their APIs (through Monetization Grabbers). This means that the statistics displayed are those recorded and reported by the ad networks themselves.
- If the goal is to view the actual statistics that ad networks have paid for or to analyze the performance of ad network SDKs, this report provides the most accurate and reliable data.
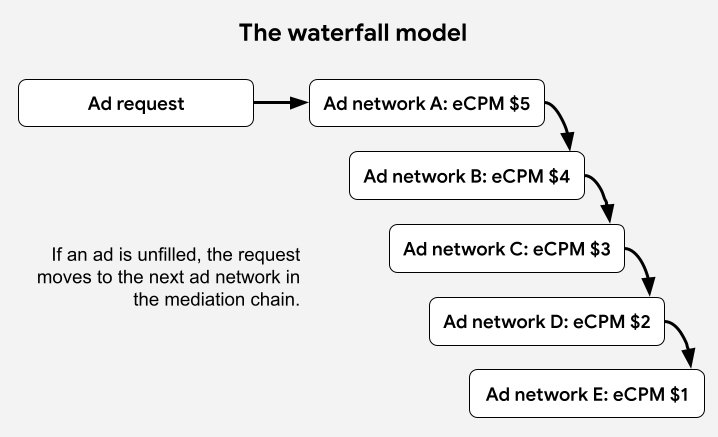
Ad Waterfall Overview
The ad waterfall refers to a traditional programmatic advertising method that organizes ad sources in a hierarchical structure. This setup ensures that the highest CPMs are prioritized for advertisers while maximizing revenue for publishers. The waterfall system sequentially moves through ad sources based on their bidding value, optimizing both ad delivery and monetization outcomes.
Filters and Dimensions
Below is a detailed list of the primary filters and dimensions available in the report, each accompanied by a description to clarify its purpose and usage:
Metrics
Below is a detailed list of the primary metrics available in the report, each accompanied by a description to clarify its purpose and usage:
Understanding the Active Users Metric and Its Dependencies
The Active Users metric, along with all metrics derived from Monetization Grabbers, can be directly correlated only within the same day, application, and country.
Key Considerations:
- Date Range Filtering:
- If the date filter includes multiple days, Active Users is calculated as the sum of active users divided by the number of days (i.e., an average value).
- Aggregation by Week and Month:
- When selecting a breakdown by week or month, DAU (Daily Active Users) does not automatically change to WAU (Weekly Active Users) or MAU (Monthly Active Users). Instead, it remains DAU, calculated as the average DAU value within the selected week or month.
Differences Between DAU, WAU, and MAU
All these metrics represent the number of unique users in the application, but over different time periods: daily (DAU), weekly (WAU), and monthly (MAU).
Example Calculation
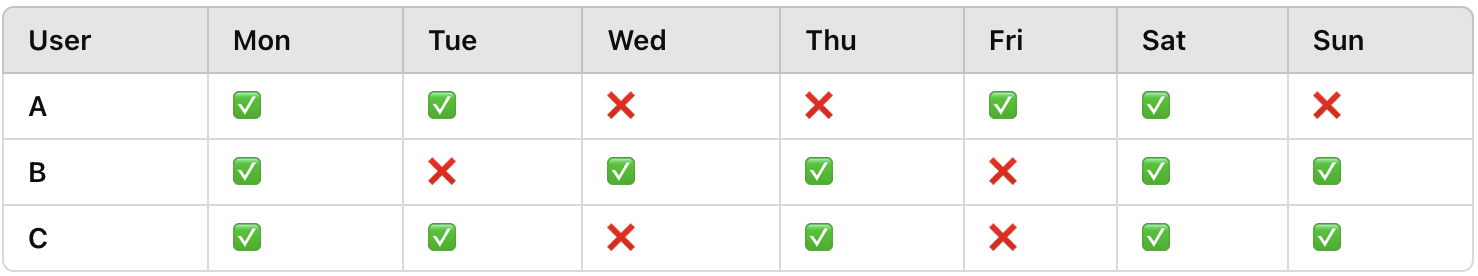
Let's assume we have three users: A, B, and C, with the following activity over a week:
- DAU Calculation (Daily Active Users Average):
- Daily Active Users per day: (4 on Monday, 5 on Tuesday, 5 on Wednesday, etc.)
- DAU (Average over the week): (4 + 5 + 5) / 7 = 2
- WAU Calculation (Weekly Active Users):
- WAU = 3, since all three users were active at least once during the week.
Where to Analyze DAU, WAU, and MAU?
To track DAU, WAU, and MAU, use the Active Users Report, which provides:
✔ The number of unique users for any selected period.
✔ Aggregations at the weekly (WAU) and monthly (MAU) levels.
This report allows a clear analysis of user engagement and trends across different timeframes.
- Breakdowns by Ad Format:
- When using Ad Format as a breakdown, Active Users is aggregated based on the total number of active users across the countries where specific ad formats are available.
- Unavailable for Network-Level Breakdowns:
- The Active Users metric, along with other metrics that rely on it—such as Impressions per Active User (Imp per Active Users) and ARPDAU (Average Revenue per Daily Active User)— is not available when breaking down data by Network, Line Item, or Campaign Name.
Most Common Example of Waterfall Performance Analysis
To analyze waterfall performance, follow these steps:
- Select the application you want to analyze.
- Choose a specific Ad Format, such as
Rewarded. - Select a country, for example,
US. - Retain dimensions like
NetworkandLine Itemto ensure detailed breakdowns. - Sort the data by descending
eCPMto organize the highest-performing ad placements. - Evaluate the performance of the waterfall by analyzing metrics like impressions, fill rate, and revenue for each
NetworkandLine Item.
Ads Monetization Dashboard
The Monetization Dashboard shares the same primary objective as the Monetization Report: to evaluate the performance of monetization strategies and their key metrics.
Both tools are designed to provide insights into the effectiveness of your monetization efforts by analyzing essential indicators such as revenue, impressions, fill rates, eCPM, and click-through rates (CTR). While the Report offers detailed data tables for granular analysis, the Dashboard provides a visual, high-level overview of these metrics, enabling faster trend identification and actionable insights.
These complementary tools ensure that you can monitor and optimize monetization performance effectively, whether you need a detailed review or a quick summary.
Filters
Below is a detailed list of the filters available in the dashboard, each accompanied by a description to clarify its purpose and usage:
Metrics
Below is a detailed list of the metrics available in the dashboard, each accompanied by a description to clarify its purpose and usage: