Active Users Report
Overview
The Active Users Report is designed to analyze user activity within the app and provide timely insights to respond to user behavior. The report displays the current number of active users for a selected time period, as well as the impressions and revenue generated by these users through in-app and ad campaigns. Depending on the selected time intervals, the report allows tracking of DAU (Daily Active Users), WAU (Weekly Active Users), and MAU (Monthly Active Users).
Key Features:
- User Activity Tracking – Monitors the number of active users across selected timeframes (DAU, WAU, MAU).
- Behavioral Insights – Provides data to identify and react to user engagement trends.
- Revenue and Impressions Analysis – Displays the impressions and revenue generated by active users through in-app purchases and ad campaigns.
- Granular Time Segmentation – Offers flexibility to analyze user activity on daily, weekly, or monthly levels.
- Decision-Making Support – Helps optimize app performance by understanding user activity and behavior patterns.
Filters and Dimensions
Below is a detailed list of the primary filters and dimensions available in the report, each accompanied by a description to clarify its purpose and usage:
Metrics
Below is a detailed list of the primary metrics available in the report, each accompanied by a description to clarify its purpose and usage:
Example Explanation from the Report
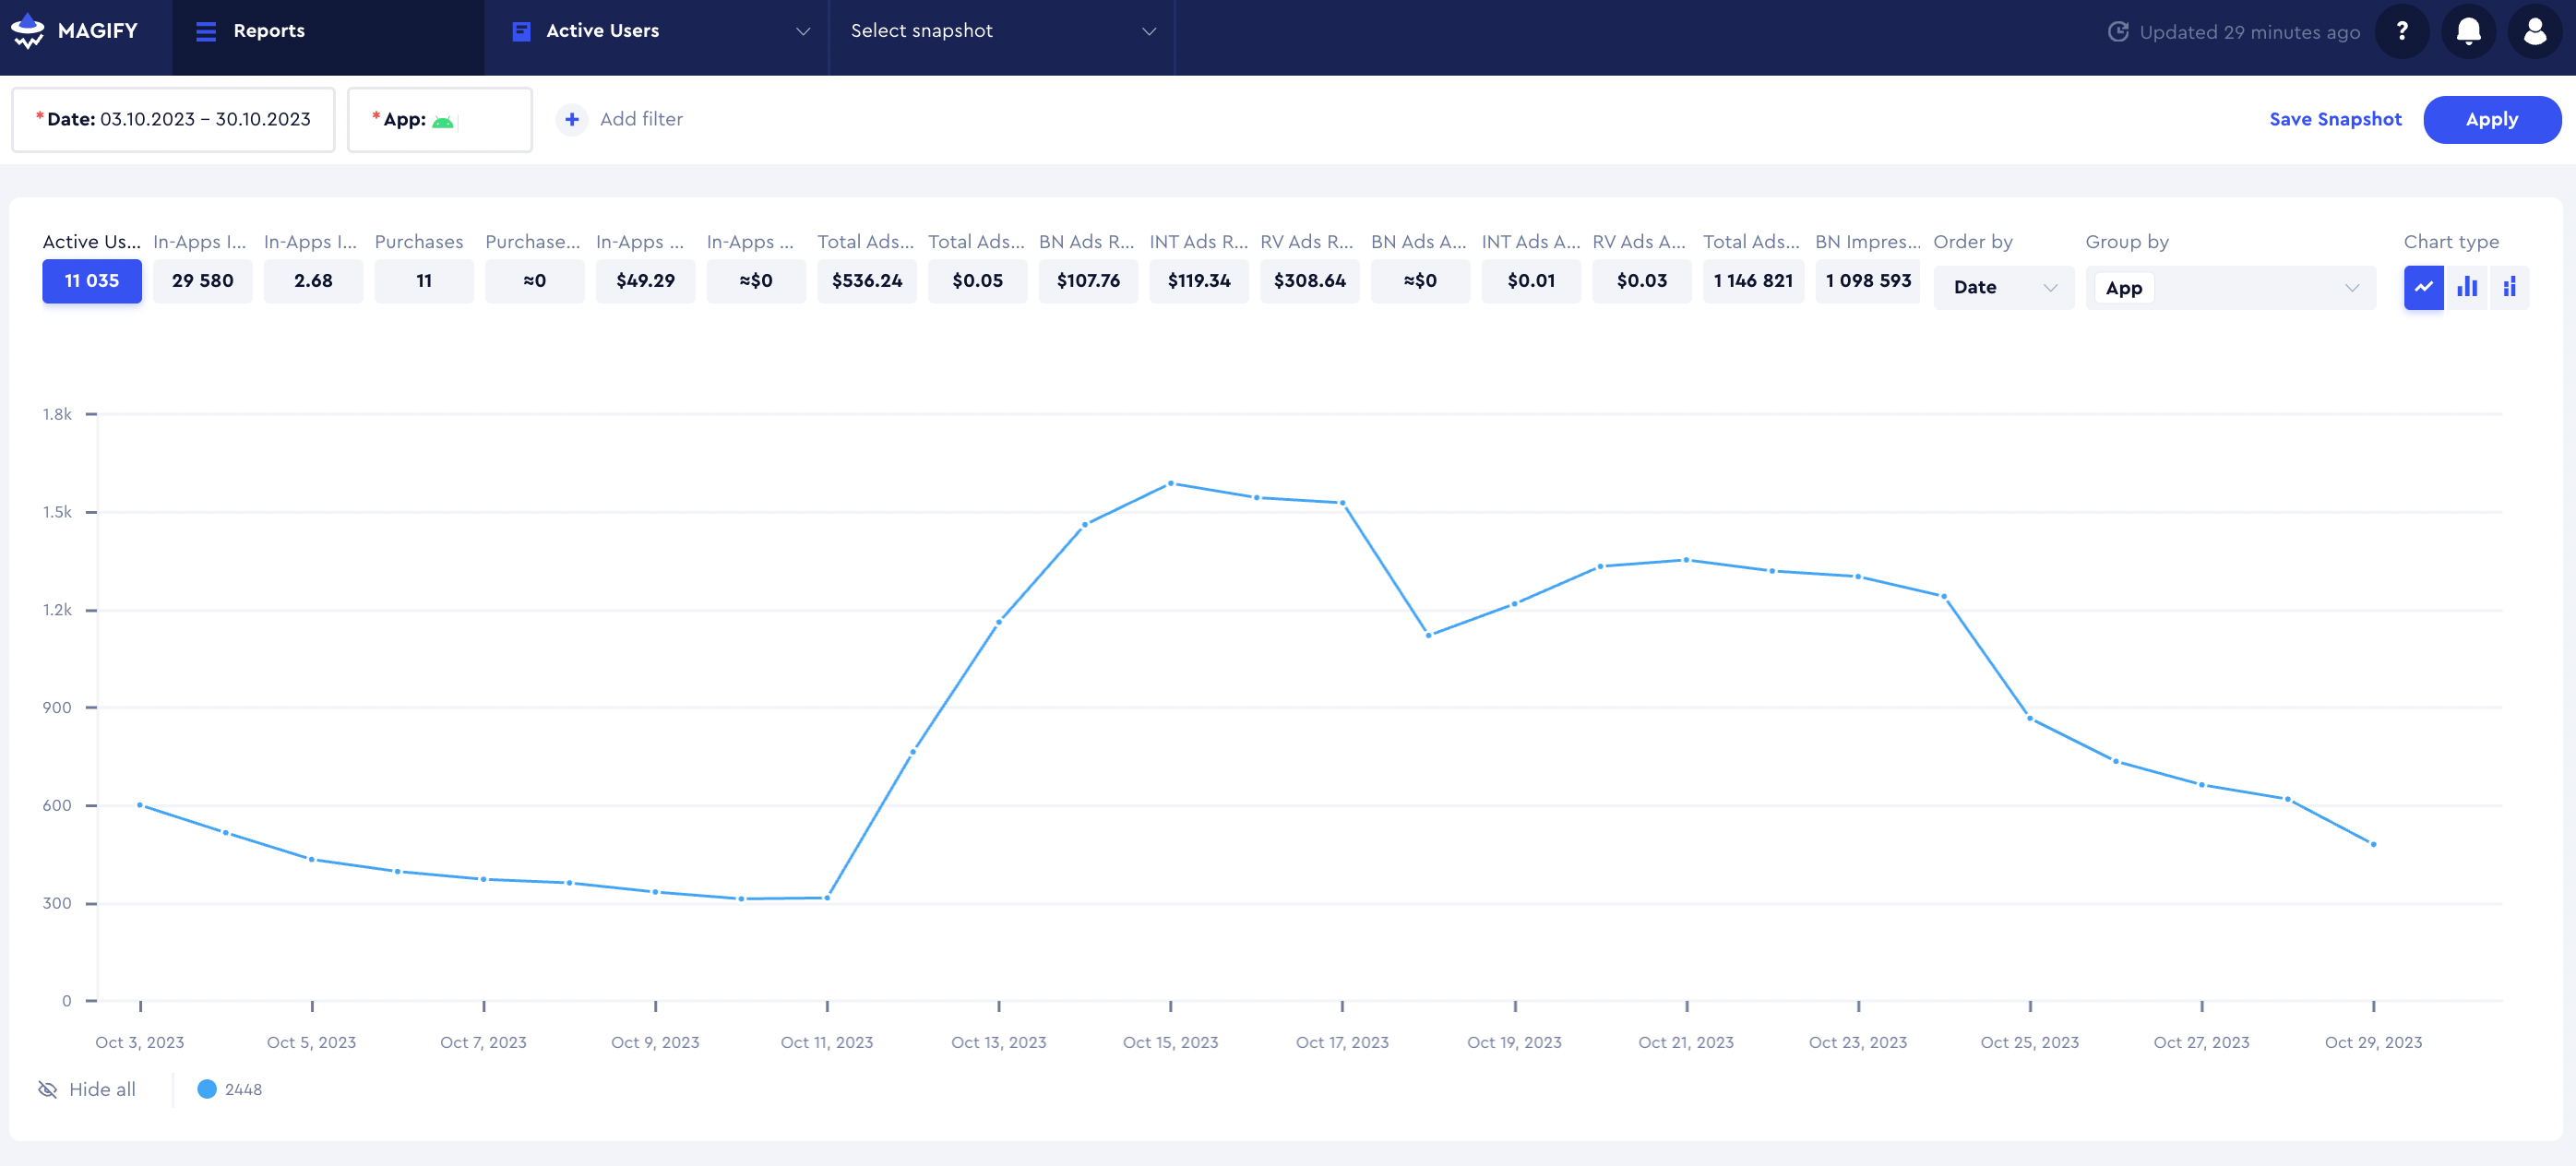
Based on the report data (screenshot below):
- On 03.08, there were 601 active users (DAU).
- These users generated $13.22 in ad revenue.
- They viewed a total of 25,427 ad impressions.
- The average ad revenue per user (ARPU) was $0.02.
This example demonstrates how key metrics such as DAU, revenue, impressions, and ARPU can provide actionable insights into user activity and monetization performance.

Additionally:
- The chart illustrates the daily user activity dynamics, showing how users engaged with the application over the selected time period.
- By selecting Order By or choosing dimensions such as Day, Week, or Month in the graph or table, you can track daily (DAU), weekly (WAU), and monthly (MAU) user activity.
