'%3e%3cpath%20d='M150.127%20195.325C233.04%20195.325%20300.255%20168.696%20300.255%20135.848C300.255%20103%20233.04%2076.3709%20150.127%2076.3709C67.2143%2076.3709%200%20103%200%20135.848C0%20168.696%2067.2143%20195.325%20150.127%20195.325Z'%20fill='white'/%3e%3cpath%20d='M231.093%20118.256L150.117%20-0.000183105L69.1527%20118.256C68.1365%20119.748%2067.5967%20121.294%2067.5967%20122.871C67.5967%20136.017%20104.538%20146.666%20150.117%20146.666C195.697%20146.666%20232.638%20136.007%20232.638%20122.871C232.638%20121.294%20232.098%20119.748%20231.082%20118.256H231.093Z'%20fill='%2301A9F2'/%3e%3cpath%20d='M150.106%20356.844L98.7265%20281.5L62.3035%20311.117L25.4253%20257.017L50.787%20239.721L68.8556%20266.226L105.279%20236.62L150.106%20302.363L194.934%20236.62L231.357%20266.226L270.045%20209.48L295.407%20226.776L237.898%20311.117L201.475%20281.5L150.106%20356.844Z'%20fill='white'/%3e%3cpath%20d='M592.168%20165.22V237.908H561.482V171.825C561.482%20153.884%20551.807%20143.034%20535.051%20143.034C516.644%20143.034%20505.318%20156.011%20505.318%20175.604V237.908H474.875V171.349C474.875%20153.407%20464.968%20142.791%20448.445%20142.791C429.804%20142.791%20418.711%20156.011%20418.711%20176.07V237.908H388.025V118.964H418.711V134.301C426.502%20122.033%20440.421%20115.418%20458.13%20115.418C477.014%20115.418%20490.7%20122.975%20498.247%20135.953C506.747%20123.208%20521.608%20115.418%20540.725%20115.418C572.819%20115.418%20592.179%20135.476%20592.179%20165.22H592.168Z'%20fill='white'/%3e%3cpath%20d='M899.48%2080.2534C899.48%2068.2182%20909.388%2059.4856%20920.248%2059.4856C931.574%2059.4856%20941.248%2068.9274%20941.248%2080.2534C941.248%2091.3465%20931.574%20100.788%20920.248%20100.788C909.155%20100.788%20899.48%2092.0557%20899.48%2080.2534Z'%20fill='white'/%3e%3cpath%20d='M935.832%20118.955H905.146V237.899H935.832V118.955Z'%20fill='white'/%3e%3cpath%20d='M1140.2%20118.955H1173L1099.84%20288.644H1067.5L1090.6%20237.666L1043.42%20118.955H1076.45L1107.37%20204.81L1140.18%20118.955H1140.2Z'%20fill='white'/%3e%3cpath%20d='M883.182%20115.418H815.904C781.45%20115.418%20755.008%20137.837%20755.008%20171.825C755.008%20206.756%20778.846%20228.466%20815.904%20228.466C831.951%20228.699%20847.288%20231.059%20847.288%20246.64C847.288%20259.617%20835.962%20267.175%20817.555%20267.175C799.148%20267.175%20784.985%20254.664%20781.915%20239.326L756.66%20246.873C763.741%20274.722%20787.346%20292.188%20817.312%20292.188C856.963%20292.188%20876.313%20272.838%20876.313%20249.233C876.313%20234.605%20869.231%20223.036%20855.545%20215.721C868.522%20206.047%20877.022%20190.709%20877.022%20171.825C877.022%20160.986%20871.412%20149.3%20863.145%20140.674H883.182V115.418ZM815.904%20203.919C797.264%20203.919%20782.392%20192.117%20782.392%20171.825C782.392%20151.534%20799.148%20139.964%20815.904%20139.964C832.66%20139.964%20849.416%20151.29%20849.416%20171.825C849.416%20188.814%20835.497%20203.919%20815.904%20203.919Z'%20fill='white'/%3e%3cpath%20d='M737.426%20237.906V118.962H708.158V136.088C698.685%20121.481%20682.796%20115.426%20668.983%20115.426C633.587%20115.426%20608.087%20143.509%20608.087%20179.148C608.087%20214.788%20633.1%20241.452%20668.03%20241.452C682.426%20241.452%20698.24%20235.08%20708.148%20220.917V237.906H737.415H737.426ZM673.471%20213.835C653.645%20213.835%20638.308%20199.207%20638.308%20178.429C638.308%20157.65%20653.889%20143.032%20673.704%20143.032C694.705%20143.032%20709.1%20160.021%20709.1%20178.429C709.1%20196.836%20694.472%20213.835%20673.46%20213.835H673.471Z'%20fill='white'/%3e%3cpath%20d='M1003.29%20111.085C1003.29%2098.5315%201011.17%2091.8842%201023.98%2091.8842C1028.9%2091.8842%201033.83%2092.6251%201037.77%2093.853L1042.2%2068.0043C1038.02%2066.7765%201027.43%2064.7971%201021.27%2064.7971C994.18%2064.7971%20972.607%2081.786%20972.607%20110.355V118.961H956.889V144.216H972.607V164.519V237.915H1003.29V144.216H1038.46V118.961H1003.29V111.096V111.085Z'%20fill='white'/%3e%3c/g%3e%3cdefs%3e%3cclipPath%20id='clip0_1_3'%3e%3crect%20width='1173'%20height='356.842'%20fill='white'/%3e%3c/clipPath%3e%3c/defs%3e%3c/svg%3e)

In-Apps Dashboard
Overview and Key Features
The In-Apps Dashboard provides insights into the performance of in-app campaigns, including In-app, In-app LTO, and their A/B versions. Additionally, it includes data from in-app purchases within Mixed and Mixed LTO campaigns, provided these campaigns contain in-app nested campaigns.
The dashboard helps evaluate and optimize campaigns aimed at promoting in-app purchases (excluding subscriptions), offering a comprehensive view of user behavior and revenue generation.
Unlike cohort-based analytics, the dashboard aggregates purchase data on a daily basis for all users (both new and existing), without linking metrics to the install date.
Key Features
- Performance Analysis for In-App Campaigns – Tracks metrics for In-app and In-app LTO campaigns, including A/B test variations.
- Non-Cohort Data Aggregation – Displays daily purchase statistics for all users, regardless of install date.
- Revenue Insights – Provides a detailed breakdown of in-app revenue generated by campaigns.
- Campaign Comparison – Enables comparison of A/B test variations to identify the most effective campaign configurations.
- Customizable Filters – Allows filtering by campaign type, date, and other dimensions for focused analysis.
The dashboard enables teams to monitor in-app monetization performance, evaluate campaign effectiveness, and make data-driven optimization decisions.
Parent and Nested Campaigns
Structure and Metrics Tracking
In the context of in-app campaigns, there are two campaign levels:
Parent Campaign
The main campaign that serves as a container. A parent campaign can include one or more nested campaigns or operate without nested campaigns.
Nested Campaign
A child campaign within a parent campaign. All purchases are attributed directly to nested campaigns, making them the primary source of transactional data.
Learn more about Parent and Nested Campaigns in the Understanding Parent and Nested Campaigns article.
Example of Campaign Breakdown
Imagine a parent campaign (Campaign A) with 10 total ad impressions. This campaign contains two nested campaigns (Campaign B and Campaign C) with different in-app purchase pricing.
The dashboard displays campaign performance as follows:
- Campaign A – Total impressions and aggregated parent campaign metrics.
- Campaign B and Campaign C – Individual performance metrics for each nested campaign, including impressions, revenue, and conversions.
This structure provides both a high-level overview of the parent campaign and detailed performance data for each nested campaign, making it easier to compare pricing strategies, campaign configurations, and A/B test variations.
Filters and Dimensions
Below is a detailed list of the primary filters and dimensions available in the report, each accompanied by a description to clarify its purpose and usage:
Metrics
Below is a detailed list of the primary metrics available in the report, each accompanied by a description to clarify its purpose and usage:
Configuration Examples and Data Interpretation in the Report
Understanding how to configure filters and dimensions correctly allows for more precise analysis of user behavior and monetization performance. Below is an example of how to set up and interpret the data in the report.
Filters:
- Country: US + UK
- In-App Status: Free
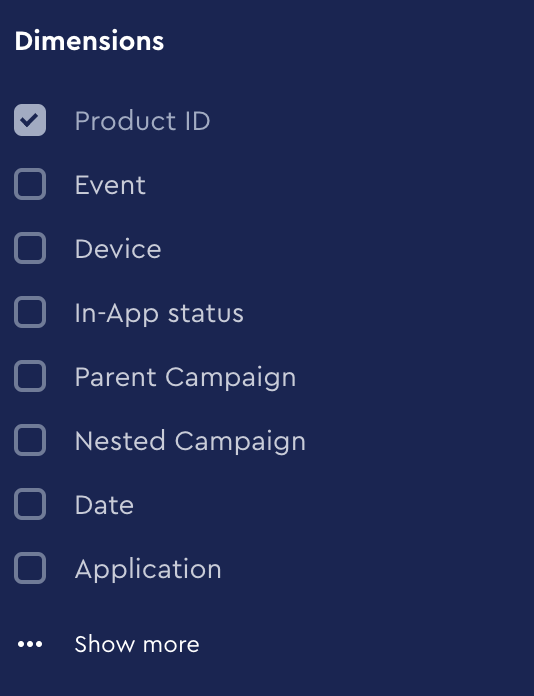
Dimensions:
- By Product ID
- By Event
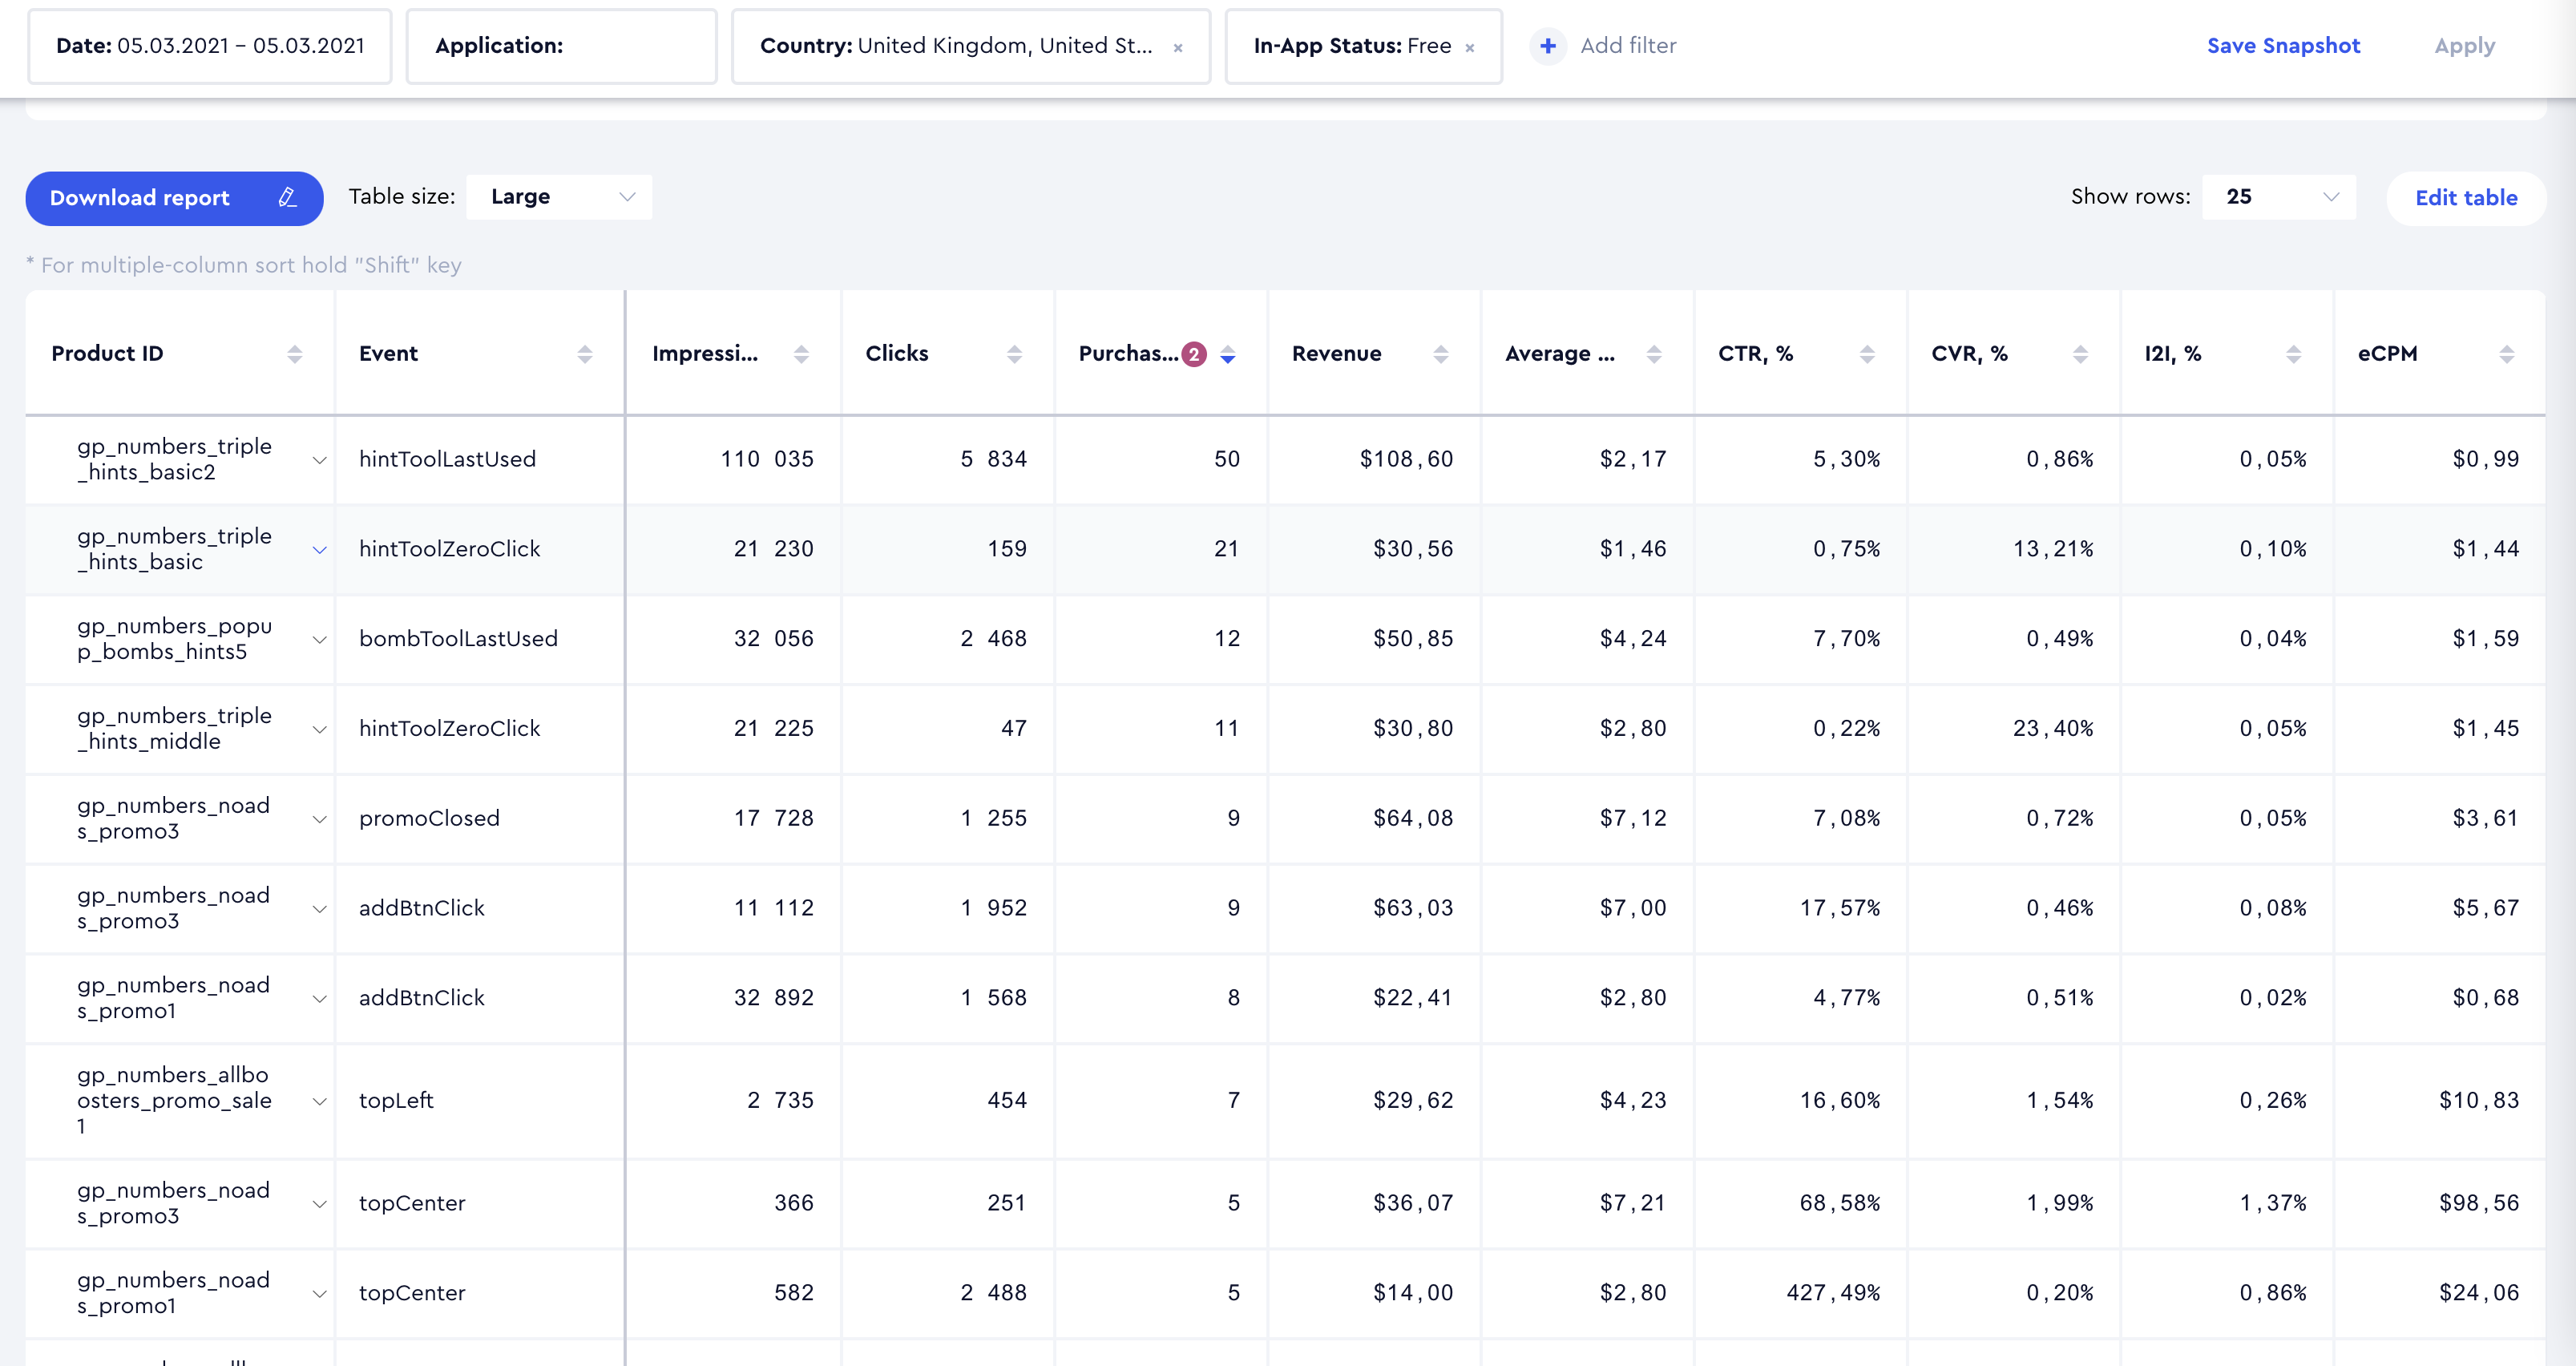
Result Interpretation:
- Each Product ID is broken down by the Event through which it was displayed or purchased, allowing for an assessment of the effectiveness of each Product ID - Event combination.
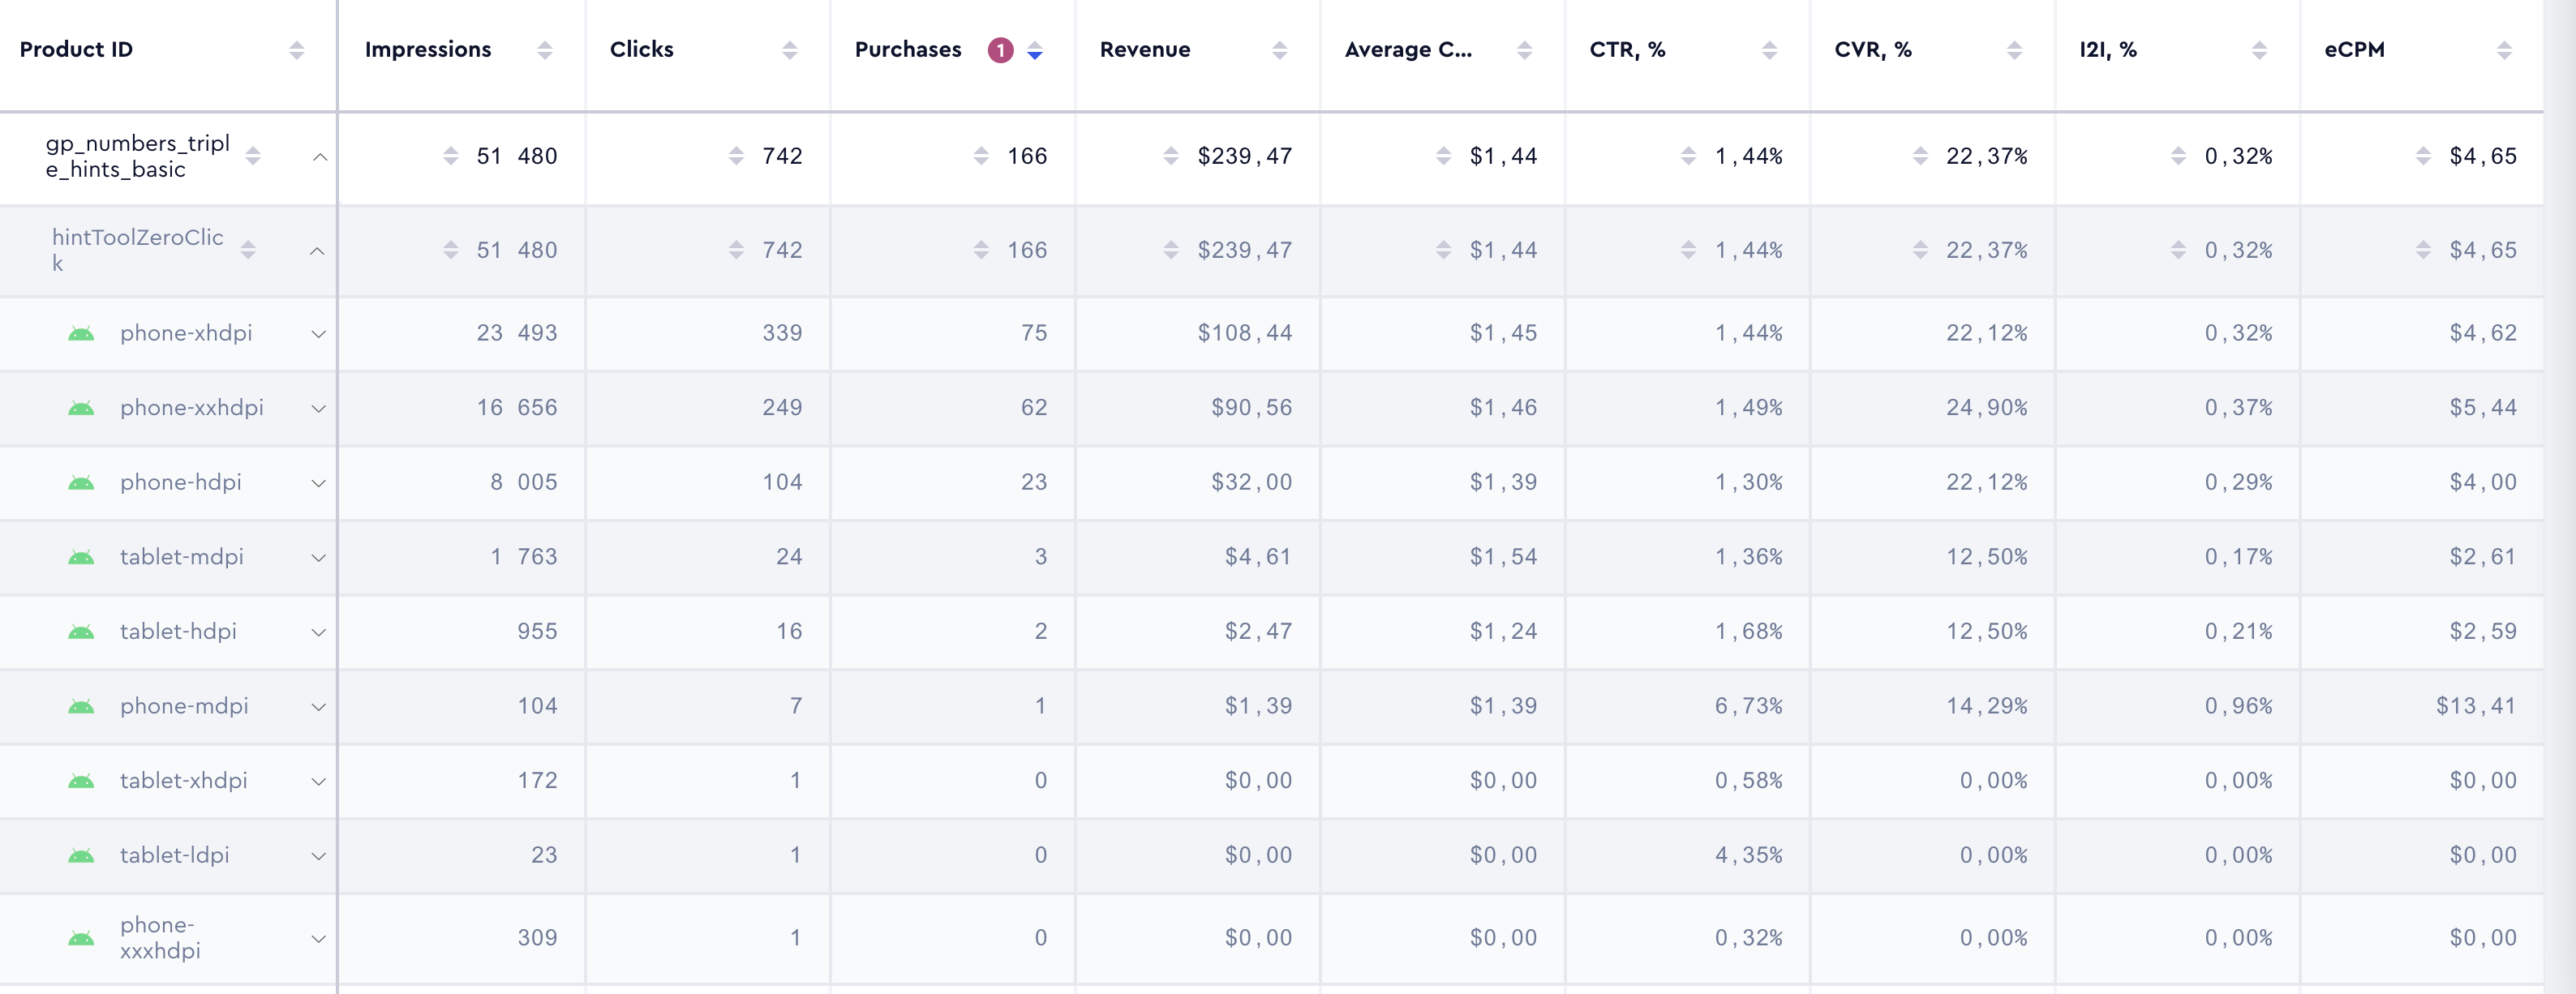
- Each Event is further expanded with a breakdown by Device for a more granular analysis.
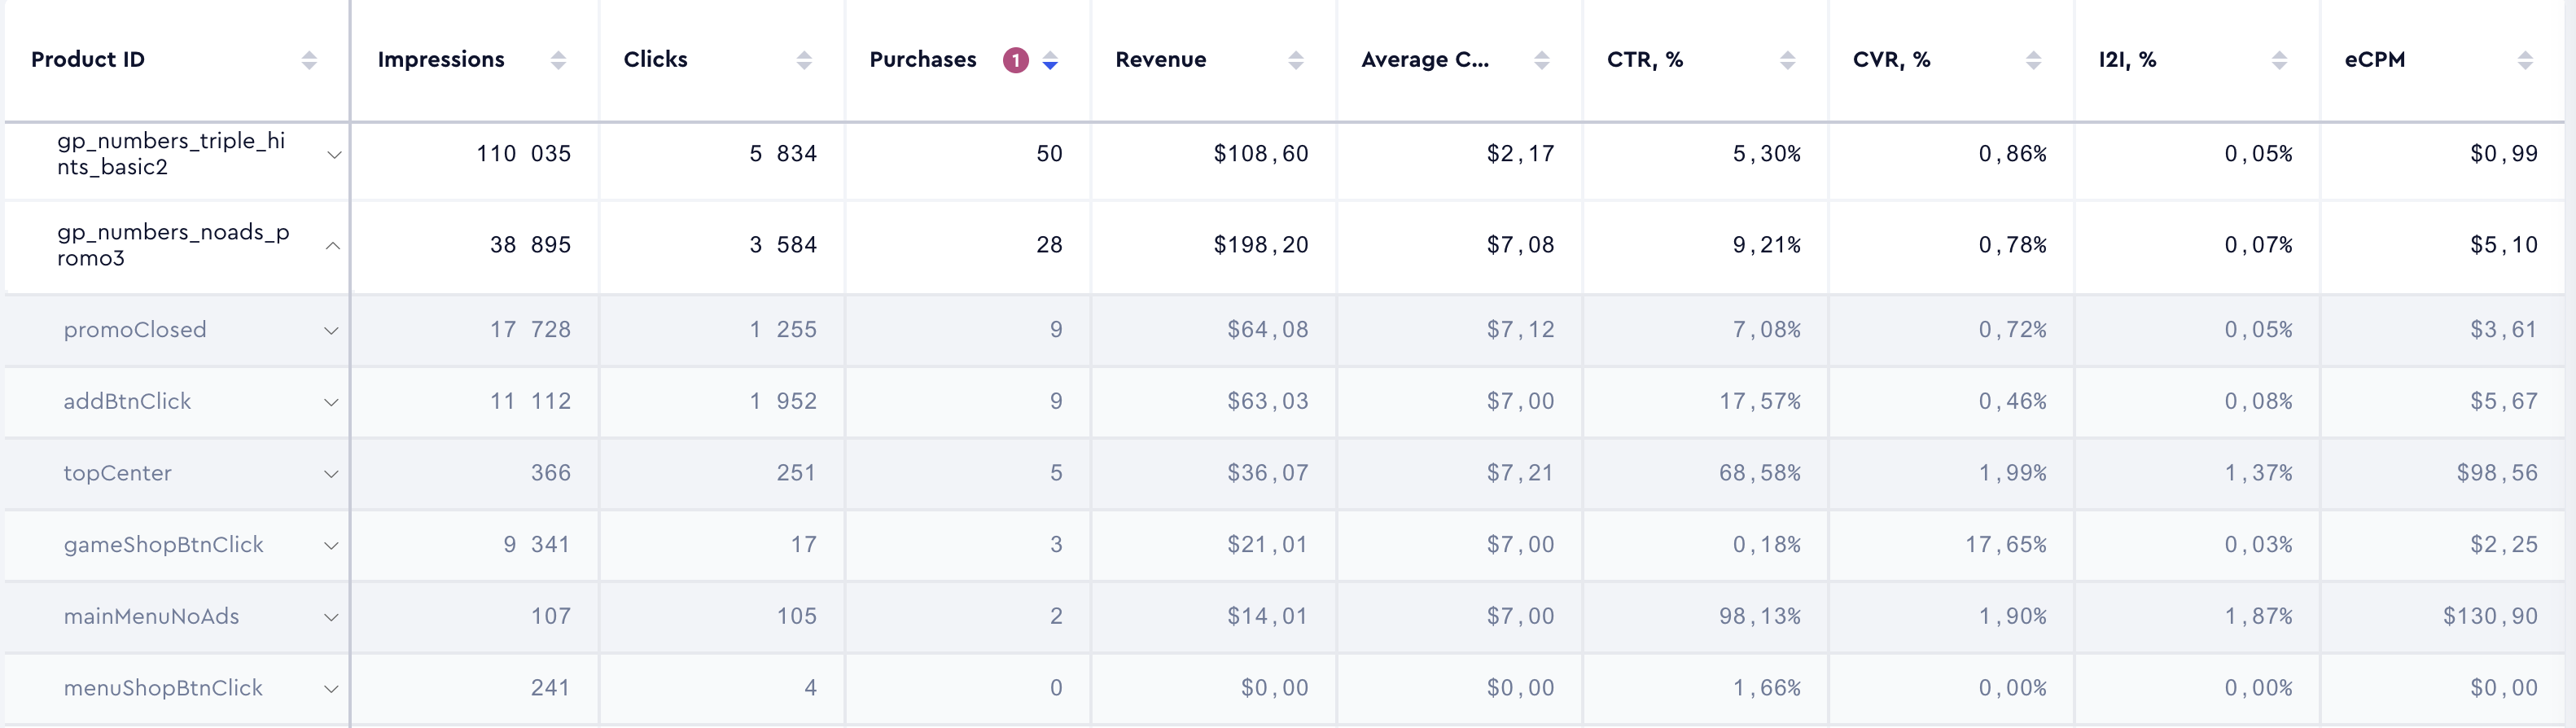
- If Product ID is listed first in the breakdown order, followed immediately by Event, the Product ID breakdown will automatically expand to show the associated Events.
In-App Dashboard
The In-Apps Dashboard provides real-time insights into in-app campaign performance, tracking revenue, engagement, and A/B test variations for In-App, In-App LTO, as well as Mixed and Mixed LTO campaigns if they contain in-app nested campaigns. Unlike cohort-based reports, it aggregates daily purchase data for all users, allowing for immediate analysis of monetization trends and campaign effectiveness.
Filters
The dashboard includes a single filter: App, allowing selection of only one app at a time:
Metrics
Below is a detailed list of the metrics available in the dashboard, each accompanied by a description to clarify its purpose and usage: